
Uploaded by
linnea
1 SLIDES
109 VUES
10LIKES
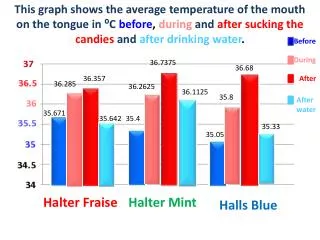
Tongue Temperature Changes During Candy Consumption
DESCRIPTION
Explore the average tongue temperature in degrees Celsius before, during, and after sucking on candies and drinking water using a graphical representation. Analyze variations in tongue heat levels based on different candy types.
Download
1 / 1
Télécharger la présentation 
Tongue Temperature Changes During Candy Consumption
An Image/Link below is provided (as is) to download presentation
Download Policy: Content on the Website is provided to you AS IS for your information and personal use and may not be sold / licensed / shared on other websites without getting consent from its author.
Content is provided to you AS IS for your information and personal use only.
Download presentation by click this link.
While downloading, if for some reason you are not able to download a presentation, the publisher may have deleted the file from their server.
During download, if you can't get a presentation, the file might be deleted by the publisher.
E N D
Presentation Transcript
This graph shows the average temperature of the mouth on the tongue in ⁰Cbefore, during andafter sucking the candies andafter drinking water. Before During 36.7375 36.68 36.357 After 36.285 36.2625 36.1125 35.8 After water 35.671 35.642 35.4 35.33 35.05 Halter Fraise Halter Mint Halls Blue


More Related