Amplification Curves of VZV DNA Detected in Positive Controls and Patient CSF via Q-PCR
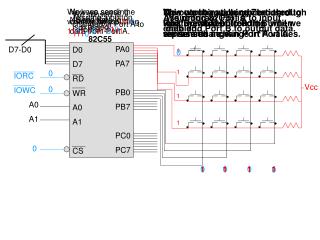
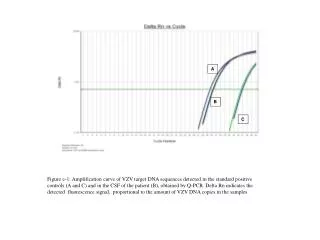
This figure illustrates the amplification curves of VZV target DNA sequences identified in standard positive controls (A and C) alongside the cerebrospinal fluid (CSF) of a patient (B), as determined through quantitative polymerase chain reaction (Q-PCR). The ΔRn represents the detected fluorescence signal, which correlates with the quantity of VZV DNA copies present in the samples. The visual data aids in understanding VZV detection in clinical settings, emphasizing the significance of Q-PCR in viral diagnostics.

Amplification Curves of VZV DNA Detected in Positive Controls and Patient CSF via Q-PCR
E N D
Presentation Transcript
A B C Figure e-1: Amplification curve of VZV target DNA sequences detected in the standard positive controls (A and C) and in the CSF of the patient (B), obtained by Q-PCR. Delta Rn indicates the detected fluorescence signal, proportional to the amount of VZV DNA copies in the samples