Download
1 / 17
350 likes | 1.32k Vues
Chapter 20 Credit and Inventory Management. 20.1 Credit and Receivables 20.2 Terms of the Sale 20.3 Analyzing Credit Policy 20.4 Optimal Credit Policy 20.5 Credit Analysis 20.6 Collection Policy 20.7 Inventory Management 20.8 Inventory Management Techniques 20.9 Summary and Conclusions.

E N D
Chapter 20Credit and Inventory Management • 20.1 Credit and Receivables • 20.2 Terms of the Sale • 20.3 Analyzing Credit Policy • 20.4 Optimal Credit Policy • 20.5 Credit Analysis • 20.6 Collection Policy • 20.7 Inventory Management • 20.8 Inventory Management Techniques • 20.9 Summary and Conclusions Vigdis Boasson Mgf301 School of Management, SUNY at Buffalo
20.2 Components of Credit Policy • Terms of sale - the conditions under which a firm sells its goods and services for cash or credit. • Credit analysis - the process of determining the probability that customers will or will not pay. • Collection policy - procedures followed by a firm in collecting accounts receivable.
20.3 The Cash Flows from Granting Credit Creditsale ismade Customermailscheck Firm depositscheck inbank Bank creditsfirm’saccount Time Cash collection Accounts receivable
20.4 Accounts Receivables • Accounts receivables = Average daily sales x average collection period.
20.5 Determinants of the Length of the Credit Period • Buyer’s inventory and operating cycle • Perishability and collateral value • Consumer demand • Cost, profitability and standardization • Credit risk • The size of the account • Competition • Customer type
20.5 Determinants of the Length of the Credit Period • Cash Discounts • 1. Cost of credit - the cost of not taking discounts offered periodic rate = (discount %)/(100 - discount %) APR = periodic rate x 365/(net period discount period) EAR = (1 + periodic rate/100)365/(net period -discount period) -1 • Example: Cost of Foregone Discounts On terms of 1/15, net 45 the cost of foregone discounts (given payment in 45 days) is: periodic rate = 1/(100 -1) = 1.01% APR = 1.01%x 365/(45 - 15) = 1.01%x12.167 = 12.29% EAR = (1 + .0101)12.167 -1 = 1.130 -1 = .130 or 13%
20.6 Credit Policy Effects • Revenue effects • Payment is received later, but price and quantity sold may increase. • Cost effects • Running a credit department and collecting receivables has costs • The cost of debt • The firm must finance receivables • The probability of nonpayment • The firm always gets paid if it sells for cash • The cash discount • Affects payment patterns and amounts
20.7 Evaluating a Proposed Credit Policy P = price per unitv = variable cost per unitQ = current quantity sold per periodQ’ = new quantity expected to be soldr = periodic required return The benefit of switching is the change in cash flow: New cash flow - old cash flow [(P - v) x Q’] - [(P - v) x Q] rearranging, (P - v) x (Q’ - Q)
20.7 Evaluating a Proposed Credit Policy (concluded) The present value of switching is: PV = [(P - v) x (Q’ - Q)]/r The cost of switching is the amount uncollected for the period + the additional variable costs of production: Cost = PQ + v(Q’ - Q) And the NPV of the switch is: NPV = -[PQ + v(Q’ - Q)] + [(P - v)(Q’ - Q)]/r Break-even =what change in Q would produce 0 NPV? Q’ - Q = PQ/[(P - v) )/r - v]
20.8 The Costs of Granting Credit (Figure 20.1) Cost in dollars Carrying costs are the cash flows that must be incurred when credit is granted. They are positively related to the amount of credit extended. Opportunity costs are the lost sales from refusing credit. These costs go down when credit is granted. Optimal amount of credit Total costs Carrying costs Opportunity costs Amount of creditextended
20.9 The Five C’s of Credit • Character • Willingness to pay • Capacity • Ability to pay • Capital • Financial reserves • Collateral • Pledged assets • Conditions • Relevant economic conditions
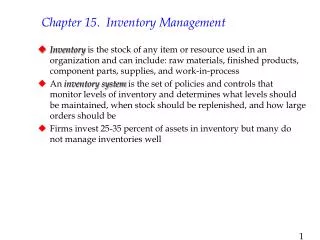
20.10 Costs of Holding Inventory (Figure 20.4) Cost in dollarsof holding inventory Restocking costs are increased when the firm holds a small quantity of inventory. Carrying costs are increased when there is a large quantity of inventory on hand. Total costs are the sum of the carrying and restocking costs. Total costs of holding inventory Carrying costs Restocking costs Size of inventoryorders (Q) Q*Optimal size of inventory order
20.12 costs of holding inventory • Total carrying costs • = Average inventory x Carrying costs per unit • = (Q/2) x CC • Total restocking costs • = Fixed cost per order x Number of orders • = F x (T/Q) • Total costs = Carrying costs + Restocking costs • = (Q/2)x CC + Fx (T/Q) • EOQ = • EOQ=economic order quantity.
20.12 Inventory Holdings for the Eyssell Corporation (Figure 20.5) Starting inventory:Q = 3,600 1,800 = Q/2 Average inventory Ending inventory: 0 Weeks 0 1 2 3 4 5 6 7 8 The Eyssell Corp. starts with inventory of 3,600 units. Inventory drops to zero by the fourth week. The average inventory is Q/2 = 3,600/2 = 1,800 over the period.
20.13 Safety Stocks and Reorder Points (Figure 20.6) Inventory (units) Minimum inventory level Safety stock Time With a safety stock, the firm reorders when inventory reaches a minimum level.
20.13 Safety Stocks and Reorder Points (Figure 20.6) (continued) Inventory (units) Reorder point Time Delivery time Delivery time When there are lags in delivery or production times, the firm reorders when inventory reaches the reorder point.
20.13 Safety Stocks and Reorder Points (Figure 20.6) (concluded) Inventory (units) Reorder point Minimum inventory level Delivery time Delivery time Time By combining safety stocks and reorder points, the firm maintains a buffer against unforeseen events.