Download
1 / 24
240 likes | 382 Vues
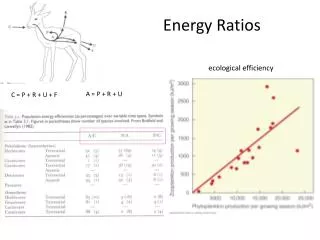
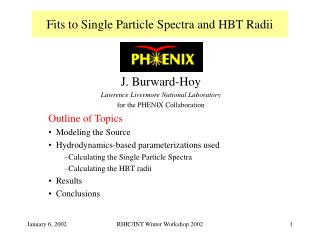
Energy and m B dependence of particle ratios and spectra. Outline: QCD Phase Diagram Theoretical view Experimental probes: AGS, SPS, RHIC Excitation functions for yields and ratios Freeze-out properties in AA collisions Exploring the QCD phases Search for (tri)critical point

E N D
Energy and mB dependence of particle ratios and spectra Outline: • QCD Phase Diagram • Theoretical view • Experimental probes: AGS, SPS, RHIC • Excitation functions for yields and ratios • Freeze-out properties in AA collisions • Exploring the QCD phases • Search for (tri)critical point • Probing Medium • Hadronization mechanisms • Energy Loss • Summary Olga Barannikova (UIC) Workshop “From High mB to High Energy” Olga Barannikova (UIC) Workshop “From High mB to High Energy”
LatticeQCDprediction T F. Karsch, hep-lat/0401031 (2004) Quark-GluonPlasma ~170 MeV TC~170 8 MeV eC~0.5 GeV/fm3 mu= md= 0, ms = The chiral phase transition changes from second to first order at a tricritical point; SC m E mu= md 0, ms = 2nd order phase transition changes into smooth cross-over E ms >>mu= md 0 Presence of the strange quark shifts E to the left; CFL SC QCD Phase Diagram
Where is the Critical Point? NJL/I Asakawa,Yazaki ’89 NJL/II ibidem CO Barducci, et al. ’89-94 NJL/inst Berges, Rajagopal ’98 RM Halasz, et al. ’98 LSM Scavenius, et al. ’01 NJL ibidem LR-1 Fodor, Katz ’01 CJT Hatta, Ikeda, ’02 HB Antoniou, Kapoyannis ’02 LTE Ejiri, et al. ’03 LR-2 Fodor, Katz ’04 — MIT Bag/QGP (only 1st order) • Theory: Theoretical (models and lattice) predictions for the location of the critical point. M. Stephanov Acta Phys.Polon.B35:2939-2962,2004
Tchem Mapping the Phase Diagram • Experiment: • Particle Yields and Statistical Models • Thermalized system of hadrons can be described by statistical model: • Hadron species are populated according to phase space probabilities (maximum entropy) (Fermi, Hagedorn) • Very successful in describing experimental data T, μq, μs,V, γs,… Schematic space–time view of a heavy ion collision
Becattini et al, PRC69(2004)024905 STAR white paper NuclPhysA757(05)102 Model Description of Yields ( NA49 data ) T=1605 MeV mB=244MeV gs =0.990.07 2 =9.6/8 dof SPS RHIC
r(m) (GeV-1) m Tch Systematics 1996 Satz: Nucl.Phys. A715 (2003) 3c 1967 • Can saturation trend be explained by Hagedorn hypotheses? • Seems correct – does not exceed Tch ~ 170 MeV • Too simplistic? But not ruled out… filled: AA open: elementary Tch approaches limiting value
mB Systematics mB drops with collision energy G. Roland From calculations by Redlich et al, Becattini et al, Braun-Munzinger et al, Rafelski et al. Baryon transport at mid-rapidity: Smooth excitation function AGSRHIC Similar trend for between AA and pp
Chemical Equilibrium: gs1 s ~ u, d P. Steinberg et al.. 1 0.8 0.6 0.4 0.2 0 gs 0 100 200 300 400 Npart • T, µB,V - vary with energy, but Λ, Ξ-yields stays constant • Change in baryon transport reflected in anti-baryons (and K) Strangeness Production H.Caines PRL 89 (2002), 092301 nucl-ex/0206008 nucl-ex/0307024
QGP Fodor, Katz JHEP04(2004)050 Cleymans and Redlich, PRL 81(1998) 5284 Hadronic phase Insensitive to centrality At RHIC (and may be SPS) chemical freeze-out may probe the phase boundary: • Success of Statistical Models describing particle yields • Chemical freeze-out: Tch, μB • SIS RHIC Phase Diagram 1st order Freeze-out parameters approach Lattice-QCD phase boundary ~at SPS energies F.O. at E 1GeV per particle
, K, p T= 90MeV, b=0.6 X, T=160MeV, b=0.45 1/pT dN/dpT Evidence for Thermalization? Transverse mass spectra at mid-rapidity NA49 STAR E.Schnedermann, J. Sollfrank, U. Heinz PRC48 (1993) 2462. Blast-wave model: and
Tdec = 100 MeV Kolb and Rapp,PRC 67 (2003) 044903. Tkin ~ Tch ~ 160 MeV ~ 0.45 at hadronization rescattering Tkin ~ 90 MeV, ~ 0.6 Blast-Wave vs. Hydro Large flow, lots of re-interactions, thermalization likely Multi-strange spectra: Hydro: single Tf.o What about fit quality? BW: lower Tkin, higher b for p,K,p compared to X, W: • Is Blast-Wave realistic?
<r> [c] Tth [GeV] Freeze-out Systematics Mohanty, Alam, et al, PRC 68 (2003) 021901 T. Nayak • Strong increase in radial flow ( <mT>) from SIS to SPS • Changing trends of freeze-out parameters between AGS and SPS energies?
Locating the Critical Point • SPSRHIC: smooth systematic behavior of all global variables Hypothetical trajectories in the phase diagram • Large fluctuations are expected when hadronization is close to Critical Point • Back to the Future Low energy scan to find the “Landmark” (Lattice-QCD phase boundary: Fodor,Katz JHEP04(2004)050)
~ 1, ~2, 3 Gavai, Fodor, Ejiri, Gupta Katz et al What Points to Critical Point? • Theory: • Experiment: Christof Roland (NA49) • “Horn” structure in K+/p(smooth rise in K-/p) • Hadronic models do not reproduce the “horn” • Strong increase in K/pfluctuations towards lower energies Cleymans et al. hep-ph/0511094
Soft Hydro,Statistical Model High mB– Summary and Future • Particle Spectra and Yields – major tools to study soft sector • Success of Hydro and Statistical Models • At RHIC the final system appears to be in local equilibrium • Chemical FO at RHIC (SPS?) coincides with hadronization • Energy scan at RHIC could locate Landmark of Phase Diagram • yields and ratios T and B
HardpQCD,FragmentationJet quenching High T – Probing Early Stage High-pT particle spectra to address properties of the created medium and hadronization mechanisms in sQGP • Energy loss mechanisms • Energy Density • Thermalization B. Wyslouch
Look at the ratio of the hadron spectra: High-pT Hadron Suppression Hadronic models: hadronic energy loss can explain at most 20% of the effect. ~pT-independence of measured RCP unlikely that hadron absorption dominates jet quenching pQCD calculations of partonic energy loss Central Au+Au: x30 gluon density, x100 energy density e=10-20 GeV/fm3 >> eC. Large pT particles are suppressed in central Au+Au (but not in d+Au).
nucl-ex/0510052 Identified RAA/RCP • Particle-type dependence of Rcp in the intermediate momentum range – • Baryons exhibit less suppression • Or less enhancement?? • hydro-like flow • gluon junction • coalescence/recombination
Au+Au 0-5% L/K0s p+p STAR Preliminary Baryon Enhancement • Intermediate pT: • Significant baryon/meson enhancement • Strong centrality dependence • Baryon/meson ratios become similar in AA and pp at pT~ 7 GeV/c • Fragmentation is not dominant at pT< 7 GeV/c
L. Ruan STAR Preliminary Color-charge dependence of E-Loss Energy loss in QCD matter: • Possible to test expectations of higher energy loss for gluons vs. quarks • X2 or X3 (S. Wicks et al., nucl-ex/0512076) • Data: • No strong centrality dependence in ratios • Same suppression in Rcp above 7 GeV/c • not consistent with the jet quenching prediction • (X.N. Wang, PRC 58 (2321) 19) • points tosimilar energy loss for partonic sources of p, pbar, and
D. d’Enterria Flavor-dependence of E-Loss • Light vs. Heavy Flavor • u,d c,b Similar energy loss for partonic sources of , p and non-photonic electrons
Summary and Outlook • Particle Yields and Spectra – major tools for experimental study of QCD matter: • Mapping the Phase Diagram • Observing Jet Quenching • Studying Thermalization • Energy Loss vs. Color-charge/Flavor • Open Questions • Establish that jet quenching is an indicator of parton E loss (Energy Scan would help to determine suppression turn-on, and study systematically quark vs. gluon jets) • Does the high initial gluon density inferred from parton E loss fits demand a deconfined initial state? • Location of the Critical Point (needs Energy Scan to higher mB)
Away side: |Dh|<1.4,|Df|>1.1 p+p Away side – Indications of thermalization Away-side jet products approach equilibration with the bulk medium thermalization of the bulk itself Measuring Energy Loss Near side: |Dh|<1.4,|Df|<1.1 F. Wang With the same final leading particle, we are selecting a larger energy jet in central AA than in pp.