Download
1 / 12
120 likes | 146 Vues
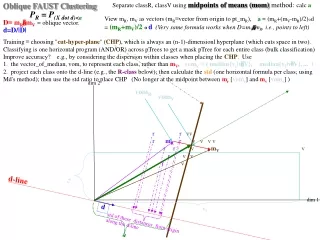
Separate classR, classV using midpoints of means (mom) method: calc a. vom V. vom R. d-line. d. v 2. v 1. std of these distances from origin along the d-line. a. Oblique FAUST Clustering P R = P (X dot d)< a D ≡ m R m V = oblique vector. d=D/|D|.

E N D
Separate classR, classV using midpoints of means (mom) method: calc a vomV vomR d-line d v2 v1 std of these distances from origin along the d-line a Oblique FAUST Clustering PR = P(X dot d)<a D≡ mRmV= oblique vector. d=D/|D| View mR, mV as vectors (mR≡vector from origin to pt_mR), a = (mR+(mV-mR)/2)od = (mR+mV)/2o d(Very same formula works when D=mVmR, i.e., points to left) Training ≡ choosing "cut-hyper-plane" (CHP), which is always an (n-1)-dimensionl hyperplane (which cuts space in two). Classifying is one horizontal program (AND/OR) across pTrees to get a mask pTree for each entire class (bulk classification) Improve accuracy? e.g., by considering the dispersion within classes when placing the CHP. Use 1. the vector_of_median, vom, to represent each class, rather than mV, vomV ≡ ( median{v1|vV}, 2. project each class onto the d-line (e.g., the R-class below); then calculate the std (one horizontal formula per class; using Md's method); then use the std ratio to place CHP (No longer at the midpoint between mr [vomr] and mv [vomv] ) median{v2|vV}, ... ) dim 2 r r vv r mR r v v v v r r v mV v r v v r v dim 1
Clustering with Oblique FAUST using cylindrical gaps(Building cylindrical gaps around round clusters) But, (y-p)o(y-p) - ((y-p)od)2 =yoy-pop - (yod-pod)2 = yoy-pop - yod2 + (2pod)yod - pod2 ypdr is not a constant shift of yoy - yod2 So the answer seems to be. NO? We find yp,d gaps using yod but need p (and d) when finding ypdr gaps? ypd y d p p d ypd gap2 ypd gap1 r0 cylinder ypdgap > GWT ypd,r gap ypd,r gap ypd gap1,gap2 mask ypdrgap >GWT2 What if clusters cannot be isolated by oblique hyperplanes? We make gaps local by adding to the d-line planar gaps, cylindrical gaps around the d-line. On a dataset,Y, we use 2 real valued functionals (or SPTSs) to define cylindrical gaps, ypd=(y-p)od (for planar gaps) and ypdr=(y-p)o(y-p)-((y-p)od)2(for cylinder gaps) d=unit_vector Question? Are gaps in these SPTSs independent of p? I.e., can we simplify and always take p=origin? (y-p)o(y-p)=yoy-pop is a shift of yoy by constant, pop, and (y-p)od=yod-pod is a shift of yp≡yod by constant pod. We search (p,d,r) for large gaps in the ypdrand ypdSPTSs. We pick a gap width threshold (GWT) and search for (p,d,r) for which Gap(ypdr)>GWT2 and Gap(ypd)>GWT. So we need a pTree-based [log(n) time] Gap Finder for these cylindrical gaps Note that the ypdgap situation changes when you change r and the ypdrgap situation changes when you change d or p, so we can't just search for ypd gaps and then search for ypdr gaps or vice versa either. A pTree-based Cylindrical Gap Finder (CGF): 1. Choose a small initial radius, r0, (a*global_density/(n-1) for some a?) 2. Create an r0 cylinder mask about pd-line (Round cluster thru which pd-line runs should reveal ypd gaps even if it doesn't enclose the cluster). 3. Identify gaps in the ypdr SPTS after it is masked to the space between ypd gap1 and gap2 Are there problems here? Yes, what if the p,d-line does not pierce our cluster near its center? Next slide.
Clustering with Oblique FAUST using cylindrical gaps 2 p d r0 cylinder yp.d gap1 yp,d gap2 ypd,,r gap ypd gap1,gap2 mask What if the pd-line doesn't pierce the cluster at its widest? yp,d gaps are still revealed but yp,d,r gaps may not be! Solution ideas? 1. Before cylinder masking (step 1) move p using gradient descent of xp,d gap width? 2. Before cylinder masking (step 1) move (p,d) using gradient descent and line search to minimize the Variance of ypd 3. Identify dense cylinders that get pieced together later? 4. Maximize each dense cylinder before finding the next? 5. We know we are in a cluster (by virtue of the fact that there are yp,d substantial gap1 and gap2) so we then move to neighboring (touching) cylinders with similar density (since they are touching there is no gap and we are confident that we are in the same cluster). 6. If we are clustering to identify outliers (anomaly detection), then the clusters we want to identify are singleton [or doubleton] sets. We can simply test each "cluster" between two gaps (and especially the end ones) for outliership (Note that we will always pierce outlier cluster at their widest). 7. For (p,d,r), r very small, do a 2Dplanar search on t=(tp,td) to maximize the variance of ypd inside the r-cylinder (this is not a gradient search but a heuristic search. The variance may not be continuously differentiable in p and d since the set of y changes as you change p or d (keeping r fixed). Also, the SPTS, ypd must be recalculated every time you change p or d). 8. For (p,d), do a 2Dplanar search on t=(tp,td) to maximize the variance of ypd over the entire space, Y. Then gradient descend to maximize the variance, then 2Dplanar search, ... CFG: Cylindrical Gap Finder: 1. Create a small radius (r0 = a*global_density/(n-1) for some a?) cylinder about the pd-line 2. Identify gaps in the yp,d,r SPTS after it's masked to the space between yp,d gap1 and gap2
f=p1 and xofM-GT=23. First round of finding Lp gaps p5' 1 1 1 0 0 1 0 0 0 0 0 0 0 0 1 p4' 1 0 0 1 0 0 0 0 0 0 1 0 1 0 0 p4' 1 0 0 1 0 0 0 0 0 0 1 0 1 0 0 p4' 1 0 0 1 0 0 0 0 0 0 1 0 1 0 0 p5' 1 1 1 0 0 1 0 0 0 0 0 0 0 0 1 p5' 1 1 1 0 0 1 0 0 0 0 0 0 0 0 1 p6' 1 1 1 1 1 0 0 0 0 0 0 0 0 0 0 p5' 1 1 1 0 0 1 0 0 0 0 0 0 0 0 1 p6' 1 1 1 1 1 0 0 0 0 0 0 0 0 0 0 p6' 1 1 1 1 1 0 0 0 0 0 0 0 0 0 0 p4' 1 0 0 1 0 0 0 0 0 0 1 0 1 0 0 p6' 1 1 1 1 1 0 0 0 0 0 0 0 0 0 0 p6' 1 1 1 1 1 0 0 0 0 0 0 0 0 0 0 p6' 1 1 1 1 1 0 0 0 0 0 0 0 0 0 0 p5' 1 1 1 0 0 1 0 0 0 0 0 0 0 0 1 p6' 1 1 1 1 1 0 0 0 0 0 0 0 0 0 0 p6' 1 1 1 1 1 0 0 0 0 0 0 0 0 0 0 p5' 1 1 1 0 0 1 0 0 0 0 0 0 0 0 1 p4' 1 0 0 1 0 0 0 0 0 0 1 0 1 0 0 p4' 1 0 0 1 0 0 0 0 0 0 1 0 1 0 0 p5' 1 1 1 0 0 1 0 0 0 0 0 0 0 0 1 p4' 1 0 0 1 0 0 0 0 0 0 1 0 1 0 0 p4' 1 0 0 1 0 0 0 0 0 0 1 0 1 0 0 p5' 1 1 1 0 0 1 0 0 0 0 0 0 0 0 1 p3' 0 0 1 1 1 1 1 1 0 1 0 0 0 0 1 p4 0 1 1 0 1 1 1 1 1 1 0 1 0 1 1 p4 0 1 1 0 1 1 1 1 1 1 0 1 0 1 1 p4 0 1 1 0 1 1 1 1 1 1 0 1 0 1 1 p4 0 1 1 0 1 1 1 1 1 1 0 1 0 1 1 p4 0 1 1 0 1 1 1 1 1 1 0 1 0 1 1 p4 0 1 1 0 1 1 1 1 1 1 0 1 0 1 1 p4 0 1 1 0 1 1 1 1 1 1 0 1 0 1 1 p4 0 1 1 0 1 1 1 1 1 1 0 1 0 1 1 p5 0 0 0 1 1 0 1 1 1 1 1 1 1 1 0 p5 0 0 0 1 1 0 1 1 1 1 1 1 1 1 0 p5 0 0 0 1 1 0 1 1 1 1 1 1 1 1 0 p5 0 0 0 1 1 0 1 1 1 1 1 1 1 1 0 p5 0 0 0 1 1 0 1 1 1 1 1 1 1 1 0 p5 0 0 0 1 1 0 1 1 1 1 1 1 1 1 0 p5 0 0 0 1 1 0 1 1 1 1 1 1 1 1 0 p5 0 0 0 1 1 0 1 1 1 1 1 1 1 1 0 p3' 0 0 1 1 1 1 1 1 0 1 0 0 0 0 1 p3 1 1 0 0 0 0 0 0 1 0 1 1 1 1 0 p3 1 1 0 0 0 0 0 0 1 0 1 1 1 1 0 p3' 0 0 1 1 1 1 1 1 0 1 0 0 0 0 1 p3' 0 0 1 1 1 1 1 1 0 1 0 0 0 0 1 p3 1 1 0 0 0 0 0 0 1 0 1 1 1 1 0 p3 1 1 0 0 0 0 0 0 1 0 1 1 1 1 0 p3' 0 0 1 1 1 1 1 1 0 1 0 0 0 0 1 p3' 0 0 1 1 1 1 1 1 0 1 0 0 0 0 1 p6 0 0 0 0 0 1 1 1 1 1 1 1 1 1 1 p6 0 0 0 0 0 1 1 1 1 1 1 1 1 1 1 p6 0 0 0 0 0 1 1 1 1 1 1 1 1 1 1 p6 0 0 0 0 0 1 1 1 1 1 1 1 1 1 1 p6 0 0 0 0 0 1 1 1 1 1 1 1 1 1 1 p6 0 0 0 0 0 1 1 1 1 1 1 1 1 1 1 p6 0 0 0 0 0 1 1 1 1 1 1 1 1 1 1 p6 0 0 0 0 0 1 1 1 1 1 1 1 1 1 1 p3 1 1 0 0 0 0 0 0 1 0 1 1 1 1 0 p3 1 1 0 0 0 0 0 0 1 0 1 1 1 1 0 p3' 0 0 1 1 1 1 1 1 0 1 0 0 0 0 1 p3' 0 0 1 1 1 1 1 1 0 1 0 0 0 0 1 p3 1 1 0 0 0 0 0 0 1 0 1 1 1 1 0 p3 1 1 0 0 0 0 0 0 1 0 1 1 1 1 0 FAUST CLUSTER-fmg:O(logn) pTree method for finding P-gaps: P ≡ ScalarPTreeSet( c ofM ) xofM 11 27 23 34 53 80 118 114 125 114 110 121 109 125 83 p6 0 0 0 0 0 1 1 1 1 1 1 1 1 1 1 p5 0 0 0 1 1 0 1 1 1 1 1 1 1 1 0 p4 0 1 1 0 1 1 1 1 1 1 0 1 0 1 1 p3 1 1 0 0 0 0 0 0 1 0 1 1 1 1 0 p2 0 0 1 0 1 0 1 0 1 0 1 0 1 1 0 p1 1 1 1 1 0 0 1 1 0 1 1 0 0 0 1 p0 1 1 1 0 1 0 0 0 1 0 0 1 1 1 1 p6' 1 1 1 1 1 0 0 0 0 0 0 0 0 0 0 p5' 1 1 1 0 0 1 0 0 0 0 0 0 0 0 1 p4' 1 0 0 1 0 0 0 0 0 0 1 0 1 0 0 p3' 0 0 1 1 1 1 1 1 0 1 0 0 0 0 1 p2' 1 1 0 1 0 1 0 1 0 1 0 1 0 0 1 p1' 0 0 0 0 1 1 0 0 1 0 0 1 1 1 0 p0' 0 0 0 1 0 1 1 1 0 1 1 0 0 0 0 X x1 x2 p1 1 1 p2 3 1 p3 2 2 p4 3 3 p5 6 2 p6 9 3 p7 15 1 p8 14 2 p9 15 3 pa 13 4 pb 10 9 pc 11 10 pd 9 11 pe 11 11 pf 7 8 f= OR between gap 2 and 3 for cluster C2={p5} width=23 =8 gap: [010 1000, 010 1111] =[40,48) width=23=8 gap: [000 0000, 000 0111]=[0,8) width=23 =8 gap: [011 1000, 011 1111] =[56,64) width = 24 =16 gap: [100 0000, 100 1111]= [64,80) width= 24 =16 gap: [101 1000, 110 0111]=[88,104) OR between gap 1 & 2 for cluster C1={p1,p3,p2,p4} between 3,4 cluster C3={p6,pf} Or for cluster C4={p7,p8,p9,pa,pb,pc,pd,pe} No zero counts yet (=gaps)
Mining Communications data prediction and anomaly detection on emails, tweets, phone, text fR 0 0 0 0 0 0 0 0 0 fR 0 0 0 fS f1,S f2,S 0 0 0 0 1 1 1 1 0 0 0 0 1 1 1 1 0 0 0 0 0 0 0 0 0 0 0 0 1 1 1 1 0 1 0 1 1 1 1 1 0 0 0 0 1 1 1 1 0 0 0 0 0 0 0 1 0 0 0 0 0 0 0 0 0 0 0 0 1 1 1 1 DSR 2 3 4 0 1 0 1 fS 5 T TD 0 fD fU fT 0 1 1 0 0 0 0 0 1 1 1 1 1 0 0 0 0 0 0 0 0 0 2 2 0 0 1 1 1 1 1 1 0 0 0 3 3 1 0 0 1 fD 0 0 0 0 0 0 4 4 fT 5 5 0 fT fD D D 0 1 0 0 1 1 0 0 1 1 2 2 0 0 0 0 0 0 0 1 1 2 3 3 3 UT 4 4 4 5 5 0 1 0 0 5 0 1 0 1 fD U U 0 0 0 1 T 0 0 1 0 0 0 0 1 Use GradientDescent+LineSearch to minimize sum of square errors, sse, where sse is the sum over all nonblanks in TD, UT and DSR. Should we train User feature segments separately (train fU with UT only and train fS and fR with DSR only?) or train U with UT and DSR, then let fS = fR = fU , so f = This will be called 3D f. FU 0 0 0 1 0 1 0 0 1 0 1 1 0 0 1 1 0 1 0 1 0 1 1 <----fT----> <----fR----> <----fS----> <----fU----> <----fD----> 0 Or training User the feature segment just once, f = This will be called 3DTU f 0 1 0 1 0 1 0 1 0 1 0 1 <----fT----> <----fD----> <fU=fS=fR> 0 1 0 1 fT DSR is binary (1 means doc was sent by Sender to Reciever). Or, Sender can be attr. of Doc(typ,Nm,Sz,HsTg,Sndr) The pSVD trick is to replace these massive relationship matrixes with small feature matrixes. Using just one feature, replace with vectors, f=fDfTfUfSfRor f=fDfTfU rec DSR sender Replace DSR with fD, fS, fR TD Replace TD with fT and fD UT Replace UT with fU and fT feature matrixes (2 features) We do pTrees conversions and train F in the CLOUD; then download the resulting F to user's personal devices for predictions, anomaly detections. The same setup should work for phone record Documents, tweet Documents (in the US Library of Congress) and text Documents, etc.
Train f as follows: Train w 2D matrix, TD Train w 2D matrix UT Train over the 3D matrix, DSR fRDSR 0 1 0 0 0 fUUT 0 0 1 0 0 0 0 0 0 0 0 fDDSR fRDSR 0 0 1 1 0 0 1 1 fSDSR fSDSR 0 0 1 0 fDDSR 0 0 1 0 1 0 0 0 DSR fTTD fTTD 2 3 4 0 0 1 1 0 0 1 1 5 fDTD fDTD D T TD 2 0 2 3 0 3 1 4 4 0 5 fUUT 5 U T 0 0 1 1 0 0 1 1 fTUT fTUT UT pSVD for Communication Analytics, f = sse=nbTD(td-TDtd)2 sse=nbUT(ut-UTut)2 sse=nbDSR(dsr-DSRdsr)2 ssed=2nbTD(td-TDtd)t sseu=2nbUT(ut-UTtd)t ssed=2nbDSR(dsr-DSRdsr)sr sset=2nbTD(td-TDtd)d sset=2nbUT(ut-UTtd)u sses=2nbDSR(dsr-DSRdsr)dr sser=2nbDSR(dsr-DSRdssr)ds pSVD classification predicts blank cell values. pSVD FAUST Cluster: Use pSVD to speed up FAUST cluster by looking for gaps in TD rather than TD (i.e., using SVD predicted values rather than actual given TD values). The same goes for DT, UT, TU, DSR, SDR, RDS. E.g., on the T(d1,...,dn) table, the tth row is pSVD estimated as (ft*d1,...,ft*dn) and the dot product vot is pSVD estimated as k=1..n vk*ft*dk So we analyze gaps in this column of values taken over all rows, t. pSVD FAUST Classification: Use pSVD to speed up FAUST Classification by finding optimal cutpoints in TD rather than TD (i.e., using SVD predicted values rather than actual given TD values). Same goes for DT, UT, TU, DSR, SDR, RDS.
A real valued vector space, T(C1..Cn) is a 2-entity (R=row entity, C=column entity) labeled relationship over rows R1..RN, columns C1..Cn Let fTi,j= fRiofC be the approximation to T fTrowi=fRifC=fRi fC1...fCn = fRifCn ... fRifCn fTcolj=fRtrfCj=fR1 fCj : fRN = fR1fCj : fRNfCj where f=(fRfC) is a F(N+n) matrix trained to minimize sse=Tij nonblank(fTij-Tij)2. Assuming one feature (i.e., F=1): One forms each SPTS by multiplying a SPTS by a number (Md's alg) So we only need the two feature SPTSs. to get the entire PTS(fT) which approximates PTS(T) A 2-entity matrix can be viewed as a vector space 2 ways. E.g., Document entity: We meld the Document table with the DSR matrix and the DT matrix to form an ultrawide Universal Doc Tbl, UD(Name,Time,Sender,Length,Term1,...,TermN,Receiver1,...,Receivern) where N=~10.000 and n=~1,000,000,000. We train 2 feature vectors to approximate UD, fD and fC where fC=(fST,fS,fL,FT1,...,fTN,fR1,...,fRn). We have found it best to train with a minimum of matrixes, which means that there will be a distinct fD vectors for each matrix.) How many bitslices in the PTreeSet for UD? Assuming an average of bitwidth=8 for its columns, that would be 8,000,080,0024 bitslices. That may be too many to be useful (e.g., for download onto an Iphone). Therefore we can appoximate PTreeSetUD with fUD as above. Whenever we need a Scalar PTreeSet representing a column, Ck, of UD (from PTreeSetUD) we can download that fCk value plus fD and multiply the SPTS, fD, by the constant, fCk to get a "good" approximation to the actual SPTS needed. We note that the concept of the join (equijoin) which is so central to the relational model, is not necessary when we use the rolodex model and focus on entities (each entity, as a join attribute is pre-joined.)
A vector space is closed under addition (adding one vector componentwise to and multiplication by a scalar (real multiplication or multiplication of a vector by a real number producing another vector). We also need component-wise multiplication (vector multiplication) (the 1st half of dot product) but is not a required vector space operation. Md and Arjun, do you have code these? 1 0 1 1 0 0 0 1 1 0 1 1 0 1 1 0 1 1 0 0 1 0 0 0 Some thoughts on scalar multiplication. It's just shifts and additions? e.g., Take v=(7,1,6,6,1,2,2,4)TR and scalar mult by 3=(0 1 1) the leftmost 1 bit in 3 shifts each bitslice 1 to the left and those get added to the unshifted bitslices (due to the units 1 bit. The results bitslices are: r3 r2 r1 r0 v2 v1 v0 due to the 1x21 in 3 v2 v2 v1 v0 due to the 1x21 in 3 v2 v2+v1 v1+v0 v0 Note vi + vj = vi XOR vj with carry vi AND vj
DSR 0 0 0 0 1 1 1 1 0 0 0 0 1 1 1 1 Item 0 0 0 0 0 0 0 0 0 0 0 0 1 1 1 1 1 1 1 1 0 0 0 0 1 1 1 1 0 0 0 0 0 0 0 0 0 0 0 0 0 0 0 0 1 1 1 1 rec 4 sender 3 2 1 People Author 2 2 1 3 2 3 4 3 4 5 5 4 5 6 7 Customer 1 1 1 1 1 1 1 1 1 1 1 Enrollments 2 1 1 1 1 1 1 1 3 Doc 1 4 movie 2 Course 3 term G 3 0 0 0 5 0 4 0 5 0 0 0 1 0 1 2 3 4 5 6 7 UT Doc 0 0 3 0 0 0 1 0 0 customer rates movie card 0 2 2 0 3 0 0 0 1 4 0 0 1 0 0 0 0 0 1 0 0 1 0 0 4 0 0 5 0 0 0 0 1 t 3 2 1 1 2 3 PI PI termterm card (share stem?) Gene 4 5 3 6 4 7 5 6 1 1 3 Gene Exp 0 0 0 0 1 0 0 0 1 0 0 0 0 0 0 0 0 customer rates movie as 5 card 0 0 0 0 0 0 0 0 0 0 0 0 0 0 0 1 0 Recalling the massive interconnection of relationships between entities, any analysis we do on this we can do after estimating each matrix using pSVD trained feature vectors for the entities. On the next slide we display the pSVD1 (one feature) replacement by a feature vector which approximates the non-blank cell values and predicts the blanks. cust item card termdoc card authordoc card genegene card (ppi) docdoc People expPI card expgene card genegene card (ppi)
1 On this slide we display the pSVD1 (one feature) replacement by a feature vector which approximates the non-blank cell values and predicts the blanks. 1 fDSR,S 1 fDSR,R Train the following feature vector thru gradient descent of sse, but that each set of matrix feature vectors be trained on only the sse over the nonblank cells of that matrix. / train these 2 on GG1 \/train these 2 on EG\/ train on GG2 \ And the same for the rest of them. Any data mining we can do with the matrixes, we can do (estimate) with the feature vectors (e.g., netflix like recommenders, prediction of blank cell values, FAUST gap based classification and clustering including anomaly detection). fUT,T fDSR,D fG5 fCI,C fG2 fUT,U fE2 Item fG4 1 1 4 fG3 3 fCI,I 2 1 fTD,T People = Author 3 4 5 6 3 4 1 2 3 4 5 6 7 2 3 4 5 2 3 2 2 3 3 4 4 5 5 =Customer=users fG1 fG1 fE,S 1 1 1 fG2 1 1 1 1 1 1 fTD,D fTD,D Doc fTT,T1 4 1 3 2 1 2 3 2 1 fE,C Course movie 3 fUM,M Gene2 1 1 fD1 fE 4 T1 G1 fD2 1 2 3 4 5 6 7 3 2 1 1 1 1 1 1 3 1 Experiment fE2 fE1 3 4 5 6 3 4 1 2 3 4 5 6 7 2 3 4 5 2 3 2 2 3 3 4 4 5 5 fTT,T2 fG5 T2 fUM,M 1 1 2 2 3 3 3 4 5 fG4 fTT,T1 G3 fG3 Doc Sender Receiver UT CI AD TD Enroll GG1 DD UserMovie ratings ExpG ExpPI TermTerm GG2
A n-dim vector space, RC(C1,...,Cn) is a matrix or TwoEntityRelationship (with row entity instances R1...RN and column entity instances C1...Cn.) ARC will denote the pSVD approximation of RC: d fC FC= f1C f2C fR 1 2 2 2 f1R f2R 5 5 1 1 3 5 3 3 Once f is trained and if d=unit n-vector, the SPTS, ARCfodt, is: 0 0 1 1 0 0 0 0 2 2 0 0 0 0 0 0 1 1 4 4 0 0 0 0 1 1 0 0 k=1..nfR1fCkdk = (fR1fC)odt = fR1(fCodt) 2 6 0 0 0 0 0 0 1 1 : : : : fR2(fCodt) (fR2fC)odt : k=1..nfR2fCkdk : 1 1 fR1k=1..nfCkdk = 4 1 2 4 1 0 ... ... ... 3 5 0 k=1..nfRNfCkdk fR2k=1..nfCkdk : (fRNfC)odt fRN(fCodt) fRNk=1..nfCkdk Once F is trained and if d=unit n-vector, the SPTS, ARCodt, is: k=1..n(f1R1f1Ck+..+fKR1fKCk)dk = (FR1oFC)odt = FR1o(FCodt) k=1..n(f1R2f1Ck+..+fKR2fKCk)dk : FR2o(FCodt) : (FR2oFC)odt : k=1..n(f1RNf1Ck+..+fKRNfKCk)dk FRNo(FCodt) (FRNoFC)odt A N+n vector, f=(fR, fC) defines prediction, pi,j=fRifCj, error, ei,j=pi,j-RCi,j then ARCf,i,j≡fRifCj and ARCf,row_i= fRifC= fRi(fC1...fCn)= (fRifC1...fRifCn). Use sse gradient descent to train f. RC C1 C2 ... Cn R1 R2 . . . RN 0 1 0 0 0 0 0 1 0 0 1 0 0 0 0 1 Compute fCodt=k=1..nfCkdk form constant SPTS with it, and multiply that SPTS by SPTS, fR. Any datamining that can be done on RC can be done using this pSVD approximation of RC, ARC e.g., FAUST Oblique (because ARCodt should show us the large gaps quite faithfully). Given any K(N+n) feature matrix, F=[FR FC], FRi=(f1Ri...fKRi), FCj=(f1Cj...fKCj) pi,j=fRiofCj=k=1..KfkRifkCj Keeping in mind that we have decided (tentatively) to approach all matrixes as rotatable tables, this then is a universal method of approximation. The big question is, how good is the approximation for data mining? It is known to be good for Netflix type recommender matrixes but what about others?
tsse Rnd 1.67 24.357 1 0.1 4.2030 2 0.124 1.8173 3 0.085 1.0415 4 0.16 0.7040 5 0.08 0.5115 6 0.24 0.3659 7 0.074 0.2741 8 0.32 0.2022 9 0.072 0.1561 10 0.4 0.1230 11 0.07 0.0935 12 0.42 0.0741 13 0.05 0.0599 14 0.07 0.0586 15 0.062 0.0553 16 0.062 0.0523 17 0.062 0.0495 18 0.063 0.0468 19 2.1 0.0014 20 0.1 0.0005 21 0.2 0.0000 22 e 1 2 3 4 5 6 7 8 9 a b 1 2 3 4 5 6 7 8 9 a b c d e f -0.23 -2.54 0.078 -4.52 -2.22 -3.56 -3.56 -3.56 -3.02 -2.22 -3.08 -3.85 0.213 -3.46 -0.18 -1.56 -2.50 -2.50 -2.50 -2.12 -1.56 -2.17 -2.71 -1.99 -3.85 -3.54 -1.74 -2.78 -2.78 -2.78 -2.36 -1.74 -2.41 -3.02 -1.99 -3.85 -3.54 -1.74 -2.78 -2.78 -2.78 -2.36 -1.74 -2.41 -3.02 -1.52 0.047 -2.71 -1.33 -2.13 -2.13 -2.13 -1.81 -1.33 -1.85 -2.31 -1.68 -3.26 -3.00 -1.47 -2.36 -2.36 -2.36 -0.00 -1.47 -2.04 -2.55 -1.99 -3.85 -3.54 -1.74 -2.78 -2.78 -2.78 -2.36 -1.74 -2.41 -3.02 -2.12 -4.11 0.215 -1.86 -2.97 -2.97 -2.97 -2.52 -1.86 -2.58 -0.22 -1.20 -2.32 -2.14 -1.05 -1.68 -1.68 -1.68 -1.42 -0.05 -1.46 -1.82 -2.53 -4.90 -4.50 -2.21 -3.54 -3.54 -3.54 -3.00 -2.21 -0.07 0.156 -1.99 -3.85 -3.54 -1.74 -2.78 -2.78 -2.78 -2.36 -1.74 -2.41 -3.02 -1.20 -2.32 -2.14 -0.05 -1.68 -1.68 -1.68 -1.42 -1.05 -1.46 -1.82 -2.54 0.078 -4.52 -2.22 -3.56 -3.56 -3.56 -3.02 -2.22 -3.08 -3.85 0.008 -3.85 -3.54 -1.74 -2.79 -2.79 -2.79 -2.36 -1.74 -2.41 -3.02 Next, consider a fax-type image dataset (blanks=zeros. sse summed over all cells). 1 2 3 4 5 6 7 8 9 a b 1 1 2 1 3 1 1 4 5 6 1 7 1 8 9 1 1 10 1 11 1 1 12 13 1 14 1 15 1 1 2 3 4 5 6 7 8 9 a b 1.03 2.13 1.49 1.67 1.67 1.27 1.41 1.67 1.78 1.00 2.12 e 1 2 3 4 5 6 7 8 9 a b c d e f 1 2 3 4 5 6 7 8 9 a b c d e f 1 2 3 4 5 6 7 8 9 a b 1.19 2.30 2.12 1.04 1.67 1.67 1.67 1.41 1.04 1.44 1.81 0.605 -0.16 -0.35 -0.00 -0.00 -0.00 -0.00 -0.00 -0.00 -0.09 -0.26 -0.00 -0.19 0.920 -0.17 -0.00 -0.00 -0.00 -0.00 -0.00 -0.00 -0.04 -0.12 -0.00 0.255 -0.30 0.327 -0.00 -0.00 -0.00 -0.00 -0.00 -0.00 -0.18 -0.49 -0.00 -0.00 -0.00 -0.00 -0.00 ******************-0.00 -0.00 -0.00 -0.00 ***** -0.00 -0.00 -0.00 -0.00 ******************-0.00 -0.00 -0.00 -0.00 ***** -0.19 0.920 -0.17 -0.00 -0.00 -0.00 -0.00 -0.00 -0.00 -0.04 -0.12 -0.00 -0.00 -0.00 -0.00 -0.00 ******************0.999 -0.00 -0.00 -0.00 ***** -0.00 -0.00 -0.00 -0.00 ******************-0.00 -0.00 -0.00 -0.00 ***** -0.60 -0.24 0.453 -0.00 -0.00 -0.00 -0.00 -0.00 -0.00 -0.15 0.596 -0.00 -0.00 -0.00 -0.00 -0.00 ******************-0.00 0.999 -0.00 -0.00 ***** -0.35 -0.14 -0.31 -0.00 -0.00 -0.00 -0.00 -0.00 -0.00 0.911 0.765 -0.00 -0.00 -0.00 -0.00 -0.00 ******************-0.00 -0.00 -0.00 -0.00 ***** -0.00 -0.00 -0.00 0.999 ******************-0.00 -0.00 -0.00 -0.00 ***** -0.19 0.920 -0.17 -0.00 -0.00 -0.00 -0.00 -0.00 -0.00 -0.04 -0.12 -0.00 0.605 -0.16 -0.35 -0.00 -0.00 -0.00 -0.00 -0.00 -0.00 -0.09 -0.26 -0.00 -0.00 -0.00 -0.00 -0.00 -0.00 -0.00 -0.00 -0.00 -0.00 ***************** ***************** -0.00 -0.00 -0.00 ***************** ***************** -0.00 -0.00 -0.00 ***************** -0.00 -0.00 -0.00 ***************** ***************** -0.00 -0.00 -0.00 -0.00 -0.00 -0.00 tr1 tr2 tr3 tr4 tr5 tr6 tr7 tr8 tr9 tra trb trc trd tre trf tc1 tc2 tc3 tc4 tc5 tc6 tc7 tc8 tc9 tca tcb tcc tcd tce tcf 6 t=1 2 3 4 5 6 7 8 9 a b c d e 3.88 0.78 0.52 0.26 0.00 0.00 0.00 0.26 0.26 0.26 0.52 0.00 0.00 0.00 1 1 1 1 1 1 1 1 1 1 1 1 1 1 -0.4 -17 -1.0 .01 .01 -17 -17 .02 -1.9 -17 -1.9 .01 -17 f 1 2 3 4 5 6 7 8 9 a b c d 0.00 0.26 0.00 0.25 0.00 0.00 0.00 0.00 0.00 -0.0 0.00 0.00 0.00 0.00 -0.0 -0.2 -0.1 -0.0 -0.0 -0.0 -0.0 -0.0 -0.0 -0.0 -0.1 -0.0 -0.0 -0.0 0.99 -0.0 -0.0 -0.0 -0.0 -0.0 -0.0 -0.0 -0.0 -0.0 -0.0 -0.0 -0.0 -0.2 0.86 -0.0 -0.0 -0.0 -0.0 -0.0 -0.0 -0.0 -0.1 -0.0 -0.0 -0.0 -0.0 -0.0 -0.0 -0.0 -0.0 -0.0 -0.0 -0.0 -0.0 -0.0 -0.0 -0.0 -0.0 -0.0 -0.0 -0.0 -0.0 -0.0 -0.0 -0.0 -0.0 -0.0 -0.0 -0.0 -0.0 -0.0 0.99 -0.0 -0.0 -0.0 -0.0 -0.0 -0.0 -0.0 -0.0 -0.0 -0.0 -0.0 -0.0 -0.0 -0.0 -0.0 -0.0 -0.0 -0.0 0.99 -0.0 -0.0 -0.0 -0.0 -0.0 -0.0 -0.0 -0.0 -0.0 -0.0 -0.0 -0.0 -0.0 -0.0 -0.0 -0.0 -0.0 -0.0 0.00 0.00 1.00 0.00 0.00 0.00 0.00 0.00 0.00 0.00 1.00 0.00 0.00 -0.0 -0.0 -0.0 -0.0 -0.0 -0.0 -0.0 -0.0 0.99 -0.0 -0.0 -0.0 -0.0 -0.0 -0.0 -0.0 -0.0 -0.0 -0.0 -0.0 -0.0 -0.0 0.99 0.99 -0.0 -0.0 -0.0 -0.0 -0.0 -0.0 -0.0 -0.0 -0.0 -0.0 -0.0 -0.0 -0.0 -0.0 -0.0 -0.0 -0.0 -0.0 0.99 -0.0 -0.0 -0.0 -0.0 -0.0 -0.0 -0.0 -0.0 -0.0 -0.0 0.99 -0.0 -0.0 -0.0 -0.0 -0.0 -0.0 -0.0 -0.0 -0.0 -0.0 -0.0 -0.0 -0.2 -0.1 -0.0 -0.0 -0.0 -0.0 -0.0 -0.0 -0.0 -0.1 -0.0 -0.0 -17 -0.5 e f 0.00 0.25 -0.0 -0.0 -0.0 -0.0 -0.0 -0.0 -0.0 -0.0 -0.0 -0.0 -0.0 -0.0 -0.0 -0.0 -0.0 -0.0 0.00 0.00 -0.0 -0.0 -0.0 -0.0 -0.0 -0.0 -0.0 -0.0 -0.0 -0.0 -0.0 -0.0 1 2 3 4 5 6 7 8 9 a b c d e f 0.06 -0.0 0.02 -0.0 -0. -0. -0. -0.0 -0.0 -0.0 -0.0 -0.0 -0.0 -0.0 -0.0 1 2 3 4 5 6 7 8 9 a b c d e f 0.01 -0.0 0.04 -0. -0. -0.0 -0.0 -0. 0.05 -0.0 0.04 -0.0 -0.0 -0.0 0.01 Of course if we take the previous data (all nonblanks=1. and we only count errors in those nonblarnks, then f=pure1 has sse=0. But of course, if it is a fax-type image (of 0/1s) then there are no blank (=0 positions must be assessed error too). So we change the data. 1 2 3 4 5 6 7 8 9 a b 1 1 2 5 3 2 3 4 5 6 3 7 2 8 9 4 3 10 1 11 3 4 12 13 1 14 5 15 2 tsse 0.25 13.128 1.04 11.057 0.4 10.633 0.6 10.436 0.4 10.349 0.6 10.298 0.4 10.266 0.6 10.241 0.5 10.223 0.4 10.209 1 10.193 0.4 10.182 0.5 10.176 0.5 10,171 0.5 10.167 0.5 10.164 0.5 10.161 0.5 10.159 0.5 10.158 0.5 10.157 0.5 10.156 0.5 10.155 0.5 10.154 0.5 10.154 Minimum sse=10.154 Without any gradient descent rounds we can knock down column 1 withT=t+(tr1...tcf) but sse=11.017 (can't go below its min=10.154)