Population and Fertility
310 likes | 541 Vues
Population and Fertility. Ashry Gad Mohamed Prof. of Epidemiology. Fertility. Mortality. Population Change. Migration. Demographic Transition Model. DTM is a hypothesis involving population changes over time

Population and Fertility
E N D
Presentation Transcript
Population and Fertility Ashry Gad Mohamed Prof. of Epidemiology
Fertility Mortality Population Change Migration
Demographic Transition Model • DTM is a hypothesis involving population changes over time • As countries become more industrialized, first their death rates and then their birth rates decline • According to the hypothesis, this transition occurs over 4 phases
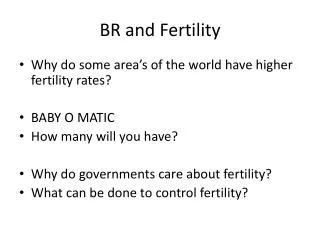
High Stationary (Pre-industrial Phase) • Little pop growth. • Harsh living conditions. • High birth • High death rate • Central Africa
Early Expanding (Transitional Phase) • Industrialization begins. • Food supply increases. • Health care improves • Death rate drops. • Birth rate stays high • Pop grows dramatically. • India
Late expanding • Birth rate drops and approaches death rate • Industrialization and modernization become widespread • Pop growth slows • Egypt, Turkey
Low Stationary • Low birth rate. • Low death rate • Stationary population • Most industrized countries
Declining • Death Rate more than birth rate • Decrease the total population. • Germany
Stage 1 Preindustrial Stage 2 Transitional Stage 3 Industrial Stage 4 Postindustrial High 80 70 60 Birth rate 50 Birth rate and death rate (number per 1,000 per year) Relative population size 40 Death rate 30 20 10 Total population Low 0 Low growth rate Increasing Growth growth rate Very high growth rate Decreasing growth rate Low growth rate Zero growth rate Negative growth rate Time Fig. 11.18, p. 233 Demographic Transition
Age Structure Diagram Green - Pre-reproductive years Dark Blue- Reproductive years Light blue - Post- reproductive years
How is Population Affected by Birth and Death Rates? 1- Rate of Natural Increase (RNI) = Number of births – number of deaths X 100 Estimated mid year population • Birth and death rates are coming down worldwide but death rates have fallen more sharply than birth rates • Growth Rate = RNI + Net migration rate
Average crude birth rate Average crude death rate World 22 9 All developed countries 11 10 All developing countries 25 9 Developing countries (w/o China) 29 9 Ave Crude Birth and Death Rates
Annual world population growth <1% 1-1.9% 2-2.9% 3+% Data not available Annual Population Growth Rate
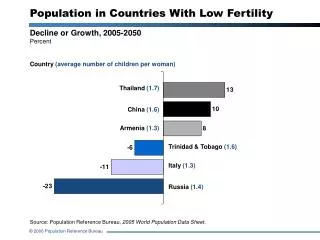
Fertility Rates 1- Replacement Level Fertility (RLF) • Number of children a couple must bear to replace themselves • Slightly higher than 2 per couple (2.1 in developed and ~2.5 in developing). • Does reaching RLF mean an immediate halt in pop growth? • No b/c so many future parents are alive
2-Total Fertility Rate (TFR) • An estimate of the average number of children a woman will have during child bearing years if between the ages of 15 and 49 she bears children at the same rate as women did this year • KSA 6.2
Fertility Rates • In 2003: • Ave global TFR was 2.8 per woman • 1.5 in developed (down from 2.5 in 1950) • 3.1 in developing (down from 6.5 in 1950) • Still far above global replacement level! • UN population projections to 2050 vary depending upon world’s projected average TFR
World 5 children per women 2.9 Developed countries 2.5 1.5 Developing countries 6.5 3.2 Africa 6.6 5.3 Latin America 5.9 2.8 Asia 5.9 2.8 Oceania 3.8 2.4 North America 3.5 2.0 Europe 2.6 1.4 2000 1950 Decline in Total Fertility Rates Fig 11-5
Births per woman < 2 4-4.9 2-2.9 5+ Data not available 3-3.9 Fig. 11.8, p. 242 Figure 11-6
What factors affect TFR? • Duration of marriage • Importance of children in labor force • Cost of raising and educating children • Contraception • Educational/employment opportunities for women • Infant mortality rate • Mother age • Number of children in the family
What factors affect death rates? • Rapid increase in world’s pop due to decline in crude death rates (not births) • More people started living longer b/c: • Increased food supplies and distribution • Better nutrition • Improved public heath (immunizations etc) • Improved sanitation and hygiene) • Safer water supplies
Two Indicators of Overall Health of People in a Country • Life Expectancy • Ave # of years an infant can expect to live • Global LE increased from 48 to 67 (76 in developed; 65 in developing) 1955-2003 • In world’s poorest =55 yrs or less • Infant Mortality Rate • # of babies out of 1000 that die before 1yr • Usually indicates lack of food, poor nutrition, poor health care, and high incidence of disease • From 1965 to 2003, IMR dropped from 20 to 7 in developed; and 118 to 61 in developing • Still means 8M infants die of preventable causes each year (=22,000 per day)
Human Life Expectancy (1999)
Death Rates Decrease Improved Medicine Maternity Care Improved Sanitation Improved Hygiene Improved Water supply Improved Food/Nutrition Agriculture Food preservation Improved Transportation Cessation of Military Conflict Birth Rates Remain High Compensate for high infant mortality Assure care for elders Provide labor Cultural/Religious practices Prohibit Birth Control Favor large families Lack of contraceptives Lack of education @ family planning Factors Affecting Birth and Death Rates in the Demographic Transition
Education of women reduces the average number of children per family
3-General Fertility rate (GFR) Number of births/y&L X 100 Number of females in child bearing age Disadvantages?
4-Marital fertility rate (fecundity rate) Number of births/y&L X 100 Number of married females in child bearing age
5-Age specific fertility rate Number of births by females in specific age group X 1000 Number of females in the same Age group
6-Crude birth rate (CBR) Number of births Y/L X 1000 Mid year population Y/L
7-Cross reproduction rate The total number of females births a woman would have in her entire reproduction life without considering mortality.