Exploring Fish Populations: A Simulation of Evolution and Survival Dynamics
170 likes | 296 Vues
This engaging activity simulates the concepts of macroevolution and microevolution through a fish population model. Participants will observe how characteristics of fish, such as color traits, affect survival and reproduction over several generations. You will start with a population of gold and brown fish, record data on births and deaths, and analyze changes in fish distributions through each generation. By observing the dynamics of birth rate, mortality, and fitness, you will gain insights into evolutionary processes and population genetics in a fun and interactive way.

Exploring Fish Populations: A Simulation of Evolution and Survival Dynamics
E N D
Presentation Transcript
Vocabulary: • Macroevolution: evolution occurring over geologic time that results in the formation of new taxonomic groups.
Microevolution: • Evolution caused by small variations that can lead to a new subspecies
Mortality: • The number of individuals that dies each year within a population.
Birthrate: • The number of individuals born each year into a population
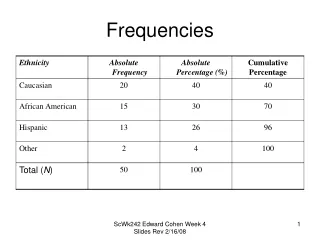
Frequency • How often a variation occurs in a population (a percentage)
Fitness: • The ability of an organism to produce offspring in a particular environment
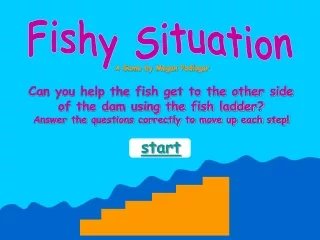
In this activity • you are a fish eating shark
2 Kinds of Fish • Gold: Tasty, Slow, and Easy to catch • A recessive trait • Brown: Salty, Fast and Hard to catch • A dominant trait
Total population: 7 Fish • Only eat some when I say to eat some • When you eat, you will always eat gold, after you run out of gold you will have to eat brown
Generation 1 • Record how many of each color fish you have under “Individual Data” • Eat 3 • Your remaining 4 fish will repopulate the fish population so you have 7 again
Generation 2 • Record your fish under “Individual Data” • Eat 3 • Your remaining 4 fish will repopulate the fish population so you have 7 again
Generation 3 • Record your fish under “Individual Data” • Eat 3 • Your remaining 4 fish will repopulate the fish population so you have 7 again
Generation 4 • Record your fish under “Individual Data” • Eat 3 • Your remaining 4 fish will repopulate the fish population so you have 7 again
Generation 5 • Record your fish under “Individual Data” • After recording you may eat all of your fish
At lab station: • Add up all of your total fish for each generation and color