Graphs in Physics
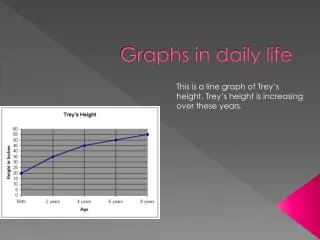
Graphs in Physics. Linear Graphs. Graphing data shows if a relationship exists between two quantities also called variables. If two variables show a linear relationship they are directly proportional to each other. Examine the following graph:. Linear Graphs. Dependent Variable.

Graphs in Physics
E N D
Presentation Transcript
Linear Graphs Graphing data shows if a relationship exists between two quantities also called variables. If two variables show a linear relationship they are directly proportional to each other. Examine the following graph:
Linear Graphs Dependent Variable Independent Variable
Linear Graphs – Slope of a Line The slope of a line is a ratio between the change in the y-value and the change in the x- value. This ratio tells whether the two quantities are related mathematically. Calculating the slope of a line is easy!
y Δy = y2 – y1 Rise = Rise Slope = Run y2 – y1 Slope = x2 – x1 x Linear Graphs – Slope of a Line y2 y1 Run = Δx = x2 – x1 x1 x2
Linear Graphs – Equation of a Line Once you know the slope then the equation of a line is very easily determined. Slope Intercept form for any line: y = mx + b y-intercept (the value of y when x =0) slope Of course in Physics we don’t use “x” & “y”. We could use F and m, or d and t, or F and x etc.)
Linear Graphs: Area Under the Curve Sometimes it’s what’s under the line that is important! Work = Force x distance W = F x d How much work was done in the first 4 m? How much work was done moving the object over the last 6 m?
Non Linear Relationships • Not all relationships between variables are linear. • Some are curves which show a squared or square root relationship In this course we use simple techniques to “straighten the curve” into linear relationship.
Non Linear Relationships This is not linear. Try squaring the x-axis values to produce a straight line graph Equation of the straight line would then be: y = x2
Non Linear Relationships This is not linear. It is an inverse relationship. Try plotting: y vs 1/x. Equation of the straight line would then be: y = 1/x
Meaning of Slope from Equations Often in Physics graphs are plotted and the calculationof and the meaning of the slope becomes an important factor. We will use the slope intercept form of the linear equation described earlier. y = mx + b
Meaning of Slope from Equations Unfortunately physicists do not use the same variables as mathematicians! s = ½ xa x t2 For example: is a very common kinematic equation. where s = distance, a = acceleration and t = time
Meaning of Slope from Equations Physicists may plot a graph of svs t, but this would yield a non-linear graph: s s To straighten the curve Square the time t t2
Meaning of Slope from Equations But what would the slope of a d vs t2 graph represent? Let’s look at the equation again: s = ½at2 {sis plotted vst2} y = mx + b What is left over must be equal to the slope of the line! slope = ½ x a {and do not forget about units: ms-2}
Meaning of Slope from Equations A physics equation will be given, as well as what is initially plotted. Now try These. Tell me what should be plotted to straighten the graph and then state what the slope of this graph would be equal to. Plot avsv2 to straighten graph Example #1: a = v2/r Let’s re-write the equation a little: a = (1/r)v2 a Therefore plotting a vs. v2would let the slope be: Slope = 1/r v
Meaning of Slope from Equations F = 2md/t2 Example #2: F Plot F vs 1/t2 to straighten the graph 1/t2 F Slope = 2md Go on to the worksheet on this topic t
Error Bars on Graphs You already know about including errors with all measured values. These errors must be included in any graph that is created using these measured value. The errors are shown as bars both in the horizontal and vertical direction. For example: 2.3 + 0.2 (horizontal ) 15.7 + 0.5 (vertical) This would be shown like this on the graph. Error Bars!
Error Bars on Graphs Plot the following data and add in the error bars:
Error Bars on Graphs Max. slope Best fit line Minimum slope