Download
1 / 46
460 likes | 620 Vues
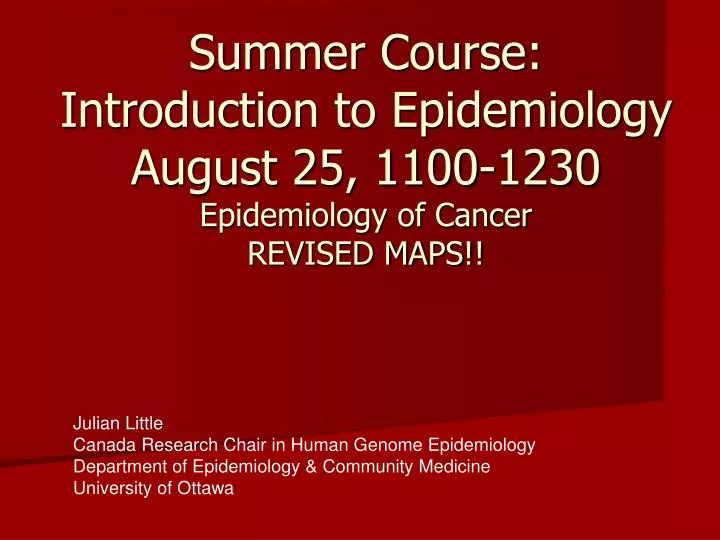
Summer Course: Introduction to Epidemiology August 25, 1100-1230 Epidemiology of Cancer REVISED MAPS!!. Julian Little Canada Research Chair in Human Genome Epidemiology Department of Epidemiology & Community Medicine University of Ottawa. Cancer Epidemiology in Canada. Julian Little

E N D
Summer Course:Introduction to EpidemiologyAugust 25, 1100-1230Epidemiology of CancerREVISED MAPS!! Julian Little Canada Research Chair in Human Genome Epidemiology Department of Epidemiology & Community Medicine University of Ottawa
Cancer Epidemiology in Canada Julian Little Canada Research Chair in Human Genome Epidemiology Department of Epidemiology & Community Medicine University of Ottawa
Plan of presentation Burden of cancer Geographical variation Risk factors Time trends Socio-economic status Childhood cancer
Sources of data • Cancer Registries: • Some provincial registries since the 1930s • Total coverage in Canada since 1969 • National Person-Oriented database since 1992
Burden of cancer in Canada in 2005 • 149 000 new cases • 69 500 deaths Canadian Cancer Society/NCIC, 2005
Potential years of life lost due to cancer Note: Figures are ranked in order of total PYLL for males and females combined and are calculated based on life expectancy. Count and percentage totals may not add due to rounding and to the exclusion of other sites. Childhood cancers are also included within the relevant sites. Smoking attributable PYLL are based on relative risk estimates from follow up of CPS-II cohort and 1996 Canadian smoking prevalence estimates. See Appendix II: Methods for details. Source: Surveillance and Risk Assessment Division, CCDPC, Public Health Agency of Canada
Cancer and Age Progress Report on Cancer Control in Canada, Health Canada
Top 10 cancers in Canada – New cases ASR 121 71 62 22 20 16 14 13 12 10 ASR 106 49 41 19 14 14 12 10 8 8 ASR: age-standardized incidence rates per 100 000 per year NHL: Non Hodgkin lymphoma Canadian Cancer Society/NICI, 2005
Estimated Cancer Incidence and Mortality in 2002 Data shown in thousands for developing and developed countries by cancer site and sex. Global Cancer Statistics, 2002
Top 10 Cancers in Canada - Deaths ASR 63 27 26 9 9 8 7 7 6 5 ASR 40 24 17 8 7 6 4 4 3 3 ASR: age-standardized incidence rates per 100 000 per year NHL: Non Hodgkin lymphoma Canadian Cancer Society/NICI, 2005
How does Canada compare with other countries?All Cancers excluding NMSC; age-standardized rates (to world population) Cancer Incidence in Five Continents, Vol 8, Data for period 1993-7
Five-year relative survival for 4 cancer sites National Cancer Institute of Canada, ISD Scotland
429.79 - < 430.37 397.51 - < 429.79 337.19 - < 389.05 Geographical variation in cancer incidence in Canada 430.37 – 482.82 389.05 - < 397.51 All Cancer Sites. Both Sexes Combined, All Ages, 1992-2001 Age-Standardized Incidence Rate per 100,000 (Canada 1991) Cancer Surveillance On-Line, CCDPC, Public Health Agency of Canada, 2002.
Geographical variation in lung cancer incidence in Canada 73.42 - 217.55 70.74 - < 73.42 57.38 - < 70.74 55.44 - < 57.38 44.45 - < 55.44 Cancer of the Lung and Bronchus. Both Sexes Combined, All Ages, 1992-2001 Age-Standardized Incidence Rate per 100,000 (Canada 1991) Cancer Surveillance On-Line, CCDPC, Public Health Agency of Canada, 2002.
Lung cancer risk factors Thun et al., Oncogene 2002; Boffetta & Nyberg, BMB 2003; Amos et al., Recent Results in Cancer Research 1999;
Lung cancer risk factors AGIR radon and public health subgroup
61.80 – 84.80 54.65 - < 60.52 47.71 - < 54.65 Geographical variation in colorectal cancer incidence in Canada 60.52 - < 61.80 42.07 - < 47.71 Cancer of the Colon and Rectum. Both Sexes Combined, All Ages, 1992-2001 Age-Standardized Incidence Rate per 100,000 (Canada 1991) Cancer Surveillance On-Line, CCDPC, Public Health Agency of Canada, 2002.
Risk factors associated with colorectal neoplasia * Approximately 2-fold increase in risk to 1st-degree relatives Little and Sharp, accepted.
102.26 – 105.24 101.04 - < 102.26 99.61 - < 101.04 Geographical variation in breast cancer incidence in Canada 95.74 - < 99.61 49.86 - < 95.74 Cancer of the Breast. Females, All Ages, 1992-2001 Age-Standardized Incidence Rate per 100,000 (Canada 1991) Cancer Surveillance On-Line, CCDPC, Public Health Agency of Canada, 2002.
Hormonal Factors Early age at menarche Late age at menopause Multiparity Late age at first full-term pregnancy OCs HRT Family history BRCA1/BRCA2 – 5% Other - ? Post-menopausal obesity Physical Activity (inverse association) Alcohol use Risk factors for breast cancer
139.00 – 151.59 137.98 - < 139.00 124.27 - < 137.98 Geographical variation in prostate cancer incidence in Canada 96.97 - < 124.27 11.10 - < 96.97 Cancer of the Prostate. Males, All Ages, 1992-2001 Age-Standardized Incidence Rate per 100,000 (Canada 1991) Cancer Surveillance On-Line, CCDPC, Public Health Agency of Canada, 2002.
Risk factors for prostate cancer • Meat consumption • Selenium (inverse association) • Family history • Androgens
10.83 – 11.76 9.77 - < 10.83 9.15 - < 9.77 Geographical variation in cervix cancer incidence in Canada 9.10 - < 9.15 7.83 - < 9.10 Cancer of the Cervix Uteri. Females, All Ages, 1992-2001 Age-Standardized Incidence Rate per 100,000 (Canada 1991) Cancer Surveillance On-Line, CCDPC, Public Health Agency of Canada, 2002.
Risk factors for cervical cancer • Smoking • OR 1.5-2.5 • HPV Electron micrograph showing HPV particles (red and green) http://www.york.ac.uk/depts/biol/units/cru/HPV%20and%20cancer.jpg
Time trends in cancer incidence - Males Trends in New Cases and Deaths Attributed to Cancer Rate, Population Growth and Population Age Structure, All Cancers, All Ages, Males, Canada,1971-2005 Surveillance and Risk Assessment Division, CCDPC, Public Health Agency of Canada
Time trends in cancer incidence - Females Trends in New Cases and Deaths Attributed to Cancer Rate, Population Growth and Population Age Structure, All Cancers, All Ages, Females, Canada,1971-2005 Surveillance and Risk Assessment Division, CCDPC, Public Health Agency of Canada
Time trends in incidence and mortality - Males Age-Standardized Incidence Rates (ASIR) for Selected Cancer Sites, Males, Canada, 1976-2005 Surveillance and Risk Assessment Division, CCDPC, Public Health Agency of Canada
Time trends in incidence and mortality - Females Age-Standardized Incidence Rates (ASIR) for Selected Cancer Sites, Females, Canada, 1976-2005 Surveillance and Risk Assessment Division, CCDPC, Public Health Agency of Canada
Time trends in incidence and mortality for selected cancer sites Percent Change in Cancer Incidence Burden (total number of cases) and Risk (age-standardized incidence rates), Incidence for Selected Cancer Sites, Canada, Over the Decade from 1992-2001 Surveillance and Risk Assessment Division, CCDPC, Public Health Agency of Canada
Time trends in prostate cancer incidence – 1970-1990 Public Health Agency of Canada, 1995
Age-specific time trends in prostate cancer incidence – 1970-72 & 1984-86 Public Health Agency of Canada, 1995
Time trends in cancer incidence vs. TURP rates – 1970-1990 Public Health Agency of Canada, 1995
Time trends in cervical cancer incidence Cervical cancer incidence and mortality in Canada, 1950-2000 Cervical Cancer in Canada, Public Health Agency of Canada, 2003
Deprivation and cancer MenWomen Positive Associations Lung Pharynx Nose Oral cavity Pharynx Oesophagus Oesophagus Stomach Stomach (Liver) (Liver) Cervix uteri Inverse associations Colon Colon Brain Melanoma of skin Melanoma of skin Breast Ovary (Faggiano et al, 1997)
Socioeconomic status and cancer ○ Ontario ● USA The relation between cancer incidence and income in Ontario and the U.S. is shown. The panels show a log-log plot of the age-standardized incidence rate of six selected cancers in each income decile in Ontario (open circles) and the U.S. (filled circles), as a function of the median household income relative to the population as a whole. Mackillop, WJ. Associations between Community Income and Cancer Incidence in Canada and the United States. 2000.
Pieter Breughel - Children´s games - Kunshistorisches Museum - Vienna, Austria
Childhood cancer in Canada • Leading cause of disease-related death among Canadians aged 1-14 years • Approximately 1300 new cases diagnosed each year in children and adolescents (< 20 years of age) • No marked variation between provinces • Small area variations
Childhood cancer in Canada Canada totals include cases from the North. The Canadian Childhood Cancer Surveillance and Control Program.
Conclusions • Act on what we know • Primary prevention • Smoking • Excess weight • Physical activity • Infection • Diet • Screening • Breast, cervical • Colorectal Behaviour change Knowledge translation Precision of evidence False positives • Can’t we do more?
Conclusions • Prevent one disease, increase risk of another • Alcohol • HRT • Aspirin
Conclusions ‘‘If causes can be removed, then susceptibility ceases to matter.’’ —Geoffrey Rose, 1985 But our current public health approaches to prevention have not been adequate • Targeting interventions • Improved understanding of underlying biology – aetiology & pathogenesis
Conclusions ‘‘Perhaps it is time to drop the competition implied by talking about a debate over nature versus nurture in favor of efforts to exploit every opportunity to identify and manipulate both environmental and genetic risk factors to improve the control of cancer’’ - Bob Hoover, 2000