Download

1 / 21
210 likes | 354 Vues
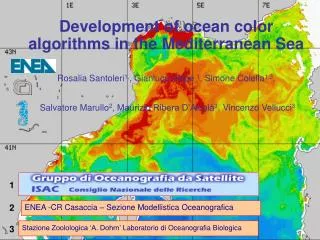
Development of ocean color algorithms in the Mediterranean Sea Rosalia Santoleri 1, Salvatore Marullo 2 , Gianluca Volpe 1 , Maurizio Ribera D’Alcalà 3 , Simone Colella 1,3 , Vincenzo Vellucci 3. 1. 2. ENEA -CR Casaccia – Sezione Modellistica Oceanografica.

E N D
Development of ocean color algorithms in the Mediterranean Sea Rosalia Santoleri1, Salvatore Marullo2, Gianluca Volpe 1, Maurizio Ribera D’Alcalà3 , Simone Colella1,3, Vincenzo Vellucci3 1 2 ENEA -CR Casaccia – Sezione Modellistica Oceanografica Stazione Zoolologica ‘A. Dohrn’ Laboratorio di Oceanografia Biologica 3
Outline • Introduction • Data and methods • Validation of OC algorithms: Regional vs Global • Discussion • Conclusions
Introduction • Chlorophyll concentrations over the oligotrophic waters of the Mediterranean Sea are systematically overestimated when global algorithms (e.g. OC4v4) are used to convert blue-to-green reflectance ratios in to chlorophyll-a concentrations: • Gitelson et al. (Journal of Marine System, 1996) • D’Ortenzio et al. (SIMBIOS meeting January 2001) • D’Ortenzio et al. (Remote sensing of the Environment, 2002) • Bricaud et al . (Remote sensing of the Environment, 2002) • Claustre et al. (Geoph. Res. Letters, 2002) • From these works it results that global algorithms cannot be applied to-court to the Mediterranean Sea but a specific cal/val activity is needed.
Validation of empirical SeaWiFS algorithms for chlorophyll-a retrieval in the Mediterranean Sea: a case study for oligotrophic seas By Fabrizio D’Ortenzio, Salvatore Marullo, Maria Ragni, Maurizio Ribera d’Alcalà, Rosalia Santoleri Remote Sensing of the Environment , 2002 DORMA Algorithm based on 1998-2000 data New data from 2000 to 2004: an independent data-set Validation of Global and Regional Algorithms (DORMA, Bricoult el at) for the Mediterranean Sea
Ocean Color Cal/Val Activity: Bio-optical measurements: 10 Mediterranean cruises (in the framework of ASI Projects and ESA AO) from 1998 up to now. (103 chl/opt measurement points) Satellite geophysical parameter retrieval and validation • In water downwelling irradiance (Ed) and upwelling radiance (Lu) profiles using SATLANTIC SPMR radiometer (400, 412, 443, 470, 490, 510, 532, 555, 590, 620, 665, 683, 700 nm) • above water measurements using the SIMBAD radiometer operating at 443nm, 490nm, 565nm, 670nm and 870nm. nm and SIMBADA radiometer operating at 350nm, 380nm, 412nm, 443nm, 490nm, 510nm, 565nm, 620nm, 670nm, 750nm and 870 nm • In the bio-optical stations phytoplankton lipophilic pigments distribution (HPLC and spectrofluorometric analysis) and ancillary biological data were also acquired following NASA protocols (M. Ribera Stazione Zoologica Napoli).
SIMBAD,SIMBADA, SATLANTC, SeaWiFS and MERIS channels central wavelengths between 400 and 700 nm
In situ chlorophyll-a profiles and optical measurements (103 stations) were performed during several cruises carried out in the Mediterranean Sea through the years 1998-2003 on board the R/V Urania of the National Research Council (CNR). SIMBIOS data taken during PROSOPE cruise were also included Satellite geophysical parameter retrieval and validation
Four Ocean Color Algorithms MERIS ATBD 2.9 : R is log10 of either the 443/560 or the 490/560 or the 510/560 band reflectance ratios. The switch from one band ratio to another one is based on the chlorophyll concentration itself. Coefficients changes according to the selected ratio. OC4v4:R is log10 of either the 443/555 or the 490/555 or the 510/555 band reflectance ratios, depending on its value (the maximum is chosen) D’Ortenzio et al. 2002 (DORMA):R is log10 of the 490/555 band reflectance ratios. Bricaud et al. 2002: R is log10 of the 443/555 band reflectance ratios for low chl (OC4v4 is used in the other cases)
Why the oligotrophic Mediterranean waters are greener? Two possible answers
A1. The role of the Sahara dust Claustre et al. 2002 suggest that, the oligotrophic waters of the Mediterranean Sea are greener than would result from their phytoplankton content alone because of the presence of Saharan dust in the upper layer that enhance absorption in the blue and backscattering in the green.
West Central East EC Programme: Energy, Environment & Sustainable Development - Project ADIOS – WP 1 – Task 1.1 From: SeaWiFS observations of Saharan dust events over the Mediterranean Sea (GOS ISAC-CNR Rome)
Number of Dust events from 1998 to 2002 as observed by SeaWiFS
A2. The role of Coccolithophores CaCO3 concentration of 5 mg/m3. This amount of calcite would in fact correspond to a coccolithophore concentration in the range between of 3·104÷2.5·105 cells/dm3 Variations in the Rrs(490)/Rrs(555) band ratio with chlorophyll-a concentration. Squares represent the in situ bio-optical measurements and the concurrent chlorophyll-a. The solid line is the semi-analytic radiance model presented in section 4. The CaCO3 concentration for the four lines are 0,1,5,50 mg/m3. The thick line represents the lower CaCO3 concentration. The higher CaCO3 concentrations yield the “flatter” curves.(D’Ortenzio et al. 2002)
The coccospheres concetrantion observed by Malinverno et al. In the oligotrophic Ionian Sea during the fall 1997 cruise is close to the concentrations that D’Ortenzio et al. 2002 suggest to have an appreciable distortion effect on the blue to green ratio (3·104÷2.5·105 cells/dm3) …Coccolithophorids are the dominant phytoplankton group in the investigated samples and reach concentrations up to 2-3 × 10⁴ coccospheres per liter of seawater at depths between surface and 25 m….(From Malinverno et al. 2003)
Conclusions • The analysis of bio-optical measurements revealed a systematic overestimation of chlorophyll-a concentration by global algorithms. The error appears to be correlated with chlorophyll-a concentration, by exhibiting marked differences at low values (C < 0.1 mg/m3). At low concentration, the mean observed bias is close to 100% for OC4v4. • A better performance is observed when regional algorithms are applyed • The OC algorithm proposed for MERIS still needs to be refined for the Mediterranean case. • DORMA algorithm, validated using the new independent data set, performs well over the all measured chl range (0.02 -2.70 mg/m3)
Conclusions • Two possible answers has been proposed to explain the observed blue-to-green reflectance ratios in the Mediterranean Sea • Claustre et al. (2002) suggest that Mediterranean Sea waters are greener than would result from their phytoplankton content alone because of the presence of Saharan dust in the upper layer that enhance absorption in the blue and backscattering in the green. This hypothesis is supported by the PROSOPE field measurements and by the analysis of Saharan dust events performed during the ADIOS project providing that residence times of dust particles in the upper layers are long enough to survive between two consecutive dust events. • D’Ortenzio el al. (2002) suggest that higher than expected coccolithophores concentrations can produce the observed blue-to-green reflectance ratios. This hypothesis is supported by the Malinverno et al. (2003) measurements in the Ionian Sea, providing that the results can be valid also for the rest of the Mediterranean.