
Uploaded by
lita
1 SLIDES
106 VUES
10LIKES
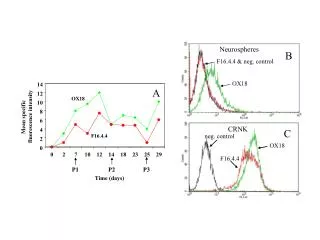
Mean Specific Fluorescence Intensity in Neurospheres Over Time
DESCRIPTION
Study of specific fluorescence intensity in neurospheres over days. Analysis of control and experimental groups to assess changes in F16.4.4.2.0.0.2.7.10.12.14.18.23.25.29.P1.P2.P3 markers.
Download
1 / 1
Télécharger la présentation 
Mean Specific Fluorescence Intensity in Neurospheres Over Time
An Image/Link below is provided (as is) to download presentation
Download Policy: Content on the Website is provided to you AS IS for your information and personal use and may not be sold / licensed / shared on other websites without getting consent from its author.
Content is provided to you AS IS for your information and personal use only.
Download presentation by click this link.
While downloading, if for some reason you are not able to download a presentation, the publisher may have deleted the file from their server.
During download, if you can't get a presentation, the file might be deleted by the publisher.
E N D
Presentation Transcript
F16.4.4 & neg. control OX18 OX18 14 A 12 OX18 10 Mean specific fluorescence intensity 8 6 4 F16.4.4 2 0 0 2 7 10 12 14 18 23 25 29 P1 P2 P3 Time (days) Neurospheres B CRNK C neg. control F16.4.4
More Related
Audio
Live Player