Download
1 / 34
350 likes | 531 Vues
Characteristics of Populations. Recall…. Habitat – the place where an organism lives Species – organisms that resemble one another in appearance, behaviour , chemistry and genetic makeup and that interbreed, or have the ability to interbreed, with each other under natural conditions .

E N D
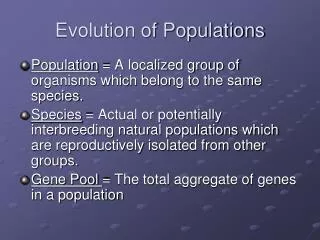
Recall… • Habitat – the place where an organism lives • Species – organisms that resemble one another in appearance, behaviour, chemistry and genetic makeup and that interbreed, or have the ability to interbreed, with each other under natural conditions
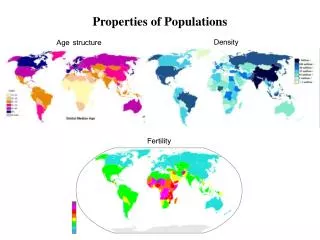
Population Size and Density • To study populations, scientists measure population size (the # of individuals in a population) and population density and dispersion of organisms. • Population Density is the # of individuals of the same species that occur per unit of volume. • D = N/S Where: D = density N = # of individuals counted S = space occupied
Some space within a habitat may be unusable to the population. • Crude density – is the # of individuals of the same species per total unit area. • Ecological density – is the # of individuals of the same species per unit area actually used.
Population Dispersion • Is the general pattern in which individuals are distributed throughout a specific area. • 3 main patterns: • Clumped dispersion: organisms are densely grouped in areas with favourable conditions, most common pattern.
Uniform dispersion: individuals are evenly distributed throughout the area. • Random dispersion: individuals are spread out in an unpredictable manner.
Measuring Population Characteristics • Biologists use a variety of sampling techniques to estimate the size and density of wild populations. • For small or stationary organisms the quadrat method is used. • A sampling frame is placed in a large area • # of individual of one or more species is counted within each quadrat • Population size and density can be estimated based on the represented sample • Results are extrapolated to the entire area
Practice: A student wants to estimate the population size and density of ragweed plants in a large field measuring 100m x 100m. She randomly places three 2m x 2m quadrats in the field. Estimate the population size and density if she finds 18, 11 and 24 ragweed plants in the three quatrats.
Practice: To estimate the size of a slug population on a golf course, a student randomly selects five 1m2quatrats in a 10m x 10m site. The number of slugs in each quadrat were 4, 8, 9, 5, 1. Estimate the population size and density of the slugs in this study site.
To estimate the size and density of mobile wildlife populations the mark-recapture method is used. • A sample of animals is captured, marked in some way (tagged), then released • After a period of time, a second sample is captured • The proportion of marked animals to unmarked animals is calculated and used to estimate the size of the entire population
Assumptions of the Mark-Recapture Method • The accuracy of this method are based on 3 assumptions: • Every organism in the population has an equal opportunity being captured. • During the time period between the initial marking and the subsequent recapture, the proportion of marked to unmarked animals remains constant. • The population size does not increase or decrease during the sampling study.
Practice: Consider a fish population of unknown size from which 26 individuals are randomly captured, marked and released. If a second sample of 21 individuals captured sometime later in which 3 individuals are found to be marked, estimate the population size.
Practice: Using the mark-recapture method, wildlife researchers surveyed an area of wetlands where 80 wood ducks were captured in traps, marked with metal bands, and then released. Two weeks later, 110 wood ducks were captured, 12 were marked. Estimate the total size of the wood ducks in the survey area.
During any given time period, biotic and abiotic resources are finite in an ecosystem. • This puts a limit to the number of organisms that an environment can support. • Carrying capacity refers to the maximum number of organisms that can be sustained by available resources over a limited period of time. • Carrying capacity is dynamic since environmental conditions are always changing. • A variety of factors, like population size and density, affect the carrying capacity of an ecosystem.
Factors that Affect Population Growth • Population dynamics refers to changes in population characteristics due to natality, mortality, immigration and emigration. • The characteristics of the species themselves will also impact the population’s dynamics. • Fecundity is the potential for a species to produce offspring in one lifetime.
Some females have the ability to produce many offspring in a lifetime, starfish can lay 1 million eggs/yr, while other females will produce few offspring, hippos only produce 20/lifetime. • A species lifespan must also be taken into consideration, longer lived species will complete more reproductive cycles.
Three general patterns in the survivorship of species. • Type 1 – low mortality rates until beyond reproductive years, long lifespan. • Type 2 – show a uniform risk or mortality throughout life time. • Type 3 – very high mortality rates when young, rate reduces if sexual maturity is reached. Pg 595, fig 3
Calculating Changes in Population Size • The population growth of any population can be calculated using the following formula:
If the number of births and immigration exceeds the number that died and emigrated, the population will have positive growth. • Negative growth will occur when deaths and emigration exceed births and immigration. • The type of growth that a population exhibits is dependent upon what type of it is. • An open population is one that is influenced by all four factors (birth, death, immigration and emigration). • A closed population is one that is influenced only by births and deaths.
Most wild populations are considered open, as organisms are free to enter or leave the population. • An organism’s ability to reproduce is another factor that must be considered. • Biotic potential is the maximum rate a population can increase under ideal conditions. • Also referred to intrinsic rate of natural increase (r).
Density-Dependent Factors • A factor that limits population growth that intensifies as the population increases in size. • The struggle for available resources within a growing population limits population size. • Intraspecific competition occurs when individuals of the same species rely on the same resources for survival. • As the population density increases, there is more competition for resources, and so growth rate slows. • Stronger individuals will survive, while the weak may die or leave the area in search of resources. • Can also affect the reproductive success of individuals, no resources = decrease in individuals growth and reproduction.
Predation is the consumption of prey by another individual. • Some predators may prefer one type of prey over another, if the population is large and easier to catch. • Results in density-dependent regulation of the preferred prey species. • Faster prey and those that are more apt to hide will survive, while those that re slower will be easier prey. • Disease can also limit a population size. • In dense, overcrowded populations, pathogens are able to pass form host to host easier, spreading at a faster rate. • Population decreases in size due to increased mortality.
Populations may also be affected when their densities are low or when they reach a small size. • This phenomena is called the allee effect. • If a population is too small it may be difficult to find mates, and offset the mortality rates. • Population size will continue to decrease until they can no longer survive.
Density-Independent Factors • A factor that limits population growth that is not related to the population density. • These can include human intervention, extreme weather changes or changes in environmental conditions. • Limiting factors prevent population from reaching their biotic potential. • These limiting factors may be shortages of environmental resources as light, space, water or nutrients, and will determine the carrying capacity of the population. • Of all the resources that are required for growth, the one that is in shortest supply is called the limiting factor. • It determines how much the individual or population can grow.
Our early ancestors began to walk upright, larger brains, allowed them to build and use tools (fire). • Hunter and Gatherers – heavy diet allowed them to travel and inhabit major landmasses. • Population size was relatively low, due to no permanent residence, low birth rates and high mortality of old, young and sick. • Profound change occurred – agriculture and domestication of animals. • Population was now stationary, increase in family size.
Now able to support a larger population size than hunting. • Fewer people were needed to tend to a farm. • People were now “free” to become artists, scholars and merchants. • This led to technological advances, political organizations, and large states. • Human population increased!
Disease • Large, stationary population lead to the evolution of pathogens. • Leads to epidemic – rapid spread of disease. • Many pathogens are believed to have originated from livestock (small pox, influenza, tuberculosis). • Repeated exposure allowed for some resistance to develop.
When people met new populations (like the aboriginals), disease spread and was fatal to the new population. • Even though there were many deaths, the human population size still increased.
Science and Medicine • Major influence of the 17th century. • Cell and germ theories were developed and are the foundations of modern medicine. • Advances in chemistry and physics allowed people to harness and convert fossil fuels into fuel energy and mechanical energy. • Resulted in the Industrial Revolution.
This brought machines, mass production of goods, and fertilizers to increase food production. • Machines replace men in the field and death rates decreased (clean water, sewage systems, vaccines). • Lead to human population explosion!