
Synergy Analysis of Lovastatin with Doxorubicin and Cisplatin in A2780 and A2780CIS Cells
This study investigates whether lovastatin synergizes with doxorubicin and cisplatin in A2780 and A2780CIS cell lines through MTT assays. Cells were treated with various concentrations of lovastatin paired with either doxorubicin or cisplatin for 24 hours. Combination index (CI) plots were created using CalcuSyn software to analyze drug interactions, revealing that lovastatin does not synergize with cisplatin (CI > 1). Additionally, significantly higher P-glycoprotein expression was observed in A2780ADR cells compared to A2780 and A2780CIS, indicating alterations in drug resistance mechanisms.

Synergy Analysis of Lovastatin with Doxorubicin and Cisplatin in A2780 and A2780CIS Cells
E N D
Presentation Transcript
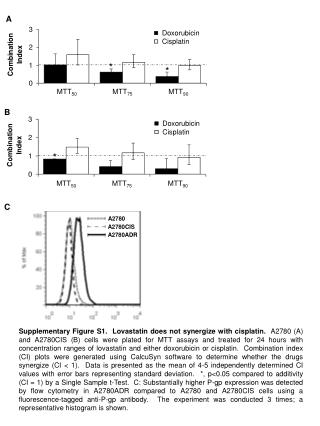
A Doxorubicin Cisplatin * * MTT50 MTT75 MTT90 B Doxorubicin Cisplatin * MTT50 MTT75 MTT90 C A2780 A2780CIS A2780ADR Supplementary Figure S1. Lovastatin does not synergize with cisplatin. A2780 (A) and A2780CIS (B) cells were plated for MTT assays and treated for 24 hours with concentration ranges of lovastatin and either doxorubicin or cisplatin. Combination index (CI) plots were generated using CalcuSyn software to determine whether the drugs synergize (CI < 1). Data is presented as the mean of 4-5 independently determined CI values with error bars representing standard deviation. *, p<0.05 compared to additivity (CI = 1) by a Single Sample t-Test. C: Substantially higher P-gp expression was detected by flow cytometry in A2780ADR compared to A2780 and A2780CIS cells using a fluorescence-tagged anti-P-gp antibody. The experiment was conducted 3 times; a representative histogram is shown.