Download
1 / 29
290 likes | 426 Vues
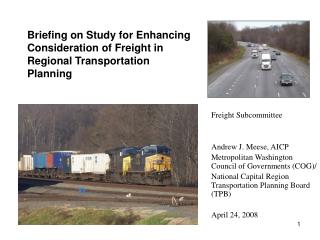
Briefing on Study for Enhancing Consideration of Freight in Regional Transportation Planning. Freight Subcommittee Andrew J. Meese, AICP Metropolitan Washington Council of Governments (COG)/ National Capital Region Transportation Planning Board (TPB) April 24, 2008. Background.

E N D
Briefing on Study for Enhancing Consideration of Freight in Regional Transportation Planning Freight Subcommittee Andrew J. Meese, AICP Metropolitan Washington Council of Governments (COG)/ National Capital Region Transportation Planning Board (TPB) April 24, 2008
Background • Consultant study on enhancing consideration of freight in regional transportation planning • Completed May 2007 • Consultant team Cambridge Systematics with Fitzgerald Halliday • Advised by an ad hoc working group of representatives from DDOT, MDOT, and VDOT
Study Objectives • Identify issues and opportunities for enhanced freight planning consideration • Lay the groundwork for specific TPB Unified Planning Work Program (UPWP) activities in future fiscal years • Ensure coordination with freight planning activities of member agencies • Develop initial freight information for use in current regional discussions and long-range transportation plan development
Key Findings: Overview • While the Washington region is not a large freight generator, its large population and vibrant economy demand a responsive freight system • The region lies at the crossroads of several important national freight corridors • Movement of goods is adversely affected by mounting highway and rail congestion • Truck stops and parking facilities are in short supply • Both local freight movement (≈ 41% by weight) and through movement (≈ 59%) are significant • Air cargo is the fastest growing segment – airports and airport ground access will remain critical
Context of State/Multi-State Freight Planning Activities • Virginia: Statewide Multimodal Freight Study; highway studies • District of Columbia: Motor Carrier Management and Threat Assessment Study; Freight Rail Realignment Feasibility Study • Maryland: Statewide Freight Plan; Baltimore activities • Multi-State: MAROps & MATOps
Key Findings: What Is Being Moved • Approximately 222 million tons of goods worth over $200 billion are transportation to, from, or within the Washington region annually • Construction materials (e.g., gravel), waste/scrap, and coal products are top commodities by weight • Machinery and textiles are top commodities by value • Significant growth is projected • It is also estimated that an additional 314 million tons of goods pass through the region annually (through traffic)
Key Findings: Modes • Approximately ¾ of the freight traveling to, from, or within the region is by truck • Other modes (final delivery usually still has to be by truck) • Rail movements are significant for high weight, non-time sensitive cargos • Air cargo, focusing on the highest value, time-sensitive goods, is the fastest growing segment – airports and airport ground access will remain critical • Pipelines move most of the petroleum products into the region • A marginal amount moves by water
Key Findings:Safety and Security • Safety considerations • Motor carrier inspection & enforcement • Driver licensing • Technology and engineering • Motorist education • Security especially important in metropolitan Washington • About 1% to 6% of trucks observed in COG/TPB field studies were placarded for hazmats • Terrorist threats – DC studies on threat and rail relocation • DC pending legal action on prohibiting rail hazmats without a permit
Data Sets • Report identifies 21 national and regional data sets identified to support regional freight planning • With descriptions and recommendations for applications • Caveats for each data set (e.g., limitations, confidentiality requirements) • Web links provided to data sets or sources when available
Passenger Versus Freight Transportation Planning Characteristics
Key Recommendations • Continue to engage in state freight activities • Form a Freight Subcommittee with both public and private sector representatives • Designate a COG/TPB staff person for freight planning • Undertake freight stakeholder outreach activities – events, surveys, personal contacts, newsletters, Web site
Data Sources Keyed to the National Freight Analysis Framework (FAF)Geography is Larger Than the TPB Area;Detailed Data Does Not Include Through Trips
Top Washington, D.C. Metro Region Trading Partners by Weight, 2002
Outbound 8% Inbound 14% Through 59% Intraregional 19% Estimated* Regional Commodity Flows By Direction of Movement By Weight * Estimates are based on 2 Sources: Inbound, Outbound, and Intraregional numbers are based on 2002FAF data. Through traffic is based on 2003 estimate in Draft Maryland Freight Profile, 2007.
Intraregional 4% Estimated* Regional Commodity Flows By Direction of Movement By Value Outbound 3% Inbound 7% Through 86% * Estimates are based on 2 Sources: Inbound, Outbound, and Intraregional numbers are based on 2002FAF data. Through traffic is based on 2003 estimate in Draft Maryland Freight Profile, 2007.
Metro Washington Freight Movement By ModeDoes Not Include Through Trips Mode Split (weight) Mode Split (value) Other* 3% Air 3% Intermodal 5% Intermodal 1% Water 1% Other* 17% Truck 76% Truck 79% Rail 5% Rail 1% Source: 2002 FAF*Other = pipeline or unknown mode
Missile Defense Propulsion Top Commodities - Value
Future Trends - 2030 • COG/TPB region will experience higher rate of growth for freight than national average. • Inbound, Outbound, and Intraregional tonnage expected to increase by 110% (national = 70%). • Inbound, Outbound, and Intraregional value expected to increase by 145% (national = 116%). • All modes will see an increase in freight traffic: 500% 50% 106% High-value commodities, like pharmaceuticals, mixed freight, electronics, and motorized vehicles are expected to grow the most, both from a tonnage standpoint and a value standpoint. More freight is projected to flow to and from the region, while slightly less freight will be traveling within the region
Highway System Regional Truck Counts
Rail System Rail Owners and Operators Rail Density
Outlook • We are now undertaking the follow-up actions to the study on committee formation and outreach • Overall, the study provides a good basis for our ongoing freight planning and better integration of freight considerations into overall regional transportation planning