Download
1 / 16
200 likes | 488 Vues
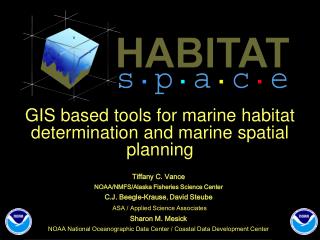
GIS based tools for marine habitat determination and marine spatial planning. Tiffany C. Vance NOAA/NMFS/Alaska Fisheries Science Center C.J. Beegle-Krause , David Steube ASA / Applied Science Associates Sharon M. Mesick

E N D
GIS based tools for marine habitat determination and marine spatial planning Tiffany C. Vance NOAA/NMFS/Alaska Fisheries Science Center C.J. Beegle-Krause, David Steube ASA / Applied Science Associates Sharon M. Mesick NOAA National Oceanographic Data Center / Coastal Data Development Center
Why look at habitat? • Climate studies look at societal impacts – habitat loss/gain/change is analogous for organisms • Legislative mandate to identify critical habitat • As ecosystem forecasting develops, need for tools to integrate climate impacts • Element of marine spatial planning – identifying critical areas and activities that can occur there • Ecosystem forecasting
Defining Habitat • Habitat crucial to survival of organisms • Habitat can be 2.5 or 3D • Determining habitat parameters for organisms, e.g. temperature ranges, altitudes or substrate types • Data gathering vs habitat modeling
Using GIS to Delineate Marine Habitat • Seagrass is a typical 2D habitat • Species interact with the surface • Bottom type, slope and currents define ‘best’ habitat • GIS provides many tools to delineate and model benthic habitats • Open ocean fish experience a multidimensional environment • Species interact with water column • Optimal pelagic habitat varies by life stage and is multivariate • Traditional GIS tools inadequate to integrate diverse time series data
Walleye Pollock in Shelikof Strait • Walleye Pollock produce the largest catch of any single species inhabiting the 200-mile U.S. Exclusive Economic Zone. • Key forage fish in the ecosystem • One spawning aggregation is in Shelikof Strait. • - Larvae transported down the Strait. • - Favorable nursery areas assumed to be inshore • - Larval dispersal studied using sampling, drifters and models
EcoFOCI Forecast Horizon Years: 1 50 INPUT: Indices ROMS/NPZ IPCC Scenario OUTPUT : Qualitative Quantitative Quantitative Scenario Prediction Prediction EXAMPLES : Ecosystems FOCI Recruitment Work in Process Considerations Predictions (Recruitment, Chapter Dominant Stabeno et al., Species (2008) Energy Flow) EcoFOCI = Ecosystems and Fisheries Oceanography Coordinated Investigations NPCREP = North Pacific Climate Regimes and Ecosystem Productivity
HabitatSpace • Pelagic habitat – 3D • Using in situ data, ocean models and biological data to define habitats • Interactive not static display • User can define parameter ranges for organism, iterative • Statistics to compare habitats
Software Elements • ArcGIS – extension and standalone tool • IDV - for analysis and visualization • netCDF files in a THREDDS server • EDC - Environmental Data Connector • ASA COASTMAP • Statistics toolbox – Python
System Architecture Data Sources Data Server Clients • Ocean Models • - NCOM, ROMS Northern Gulf Institute Ecosystem Data Assembly Center • ESRI ArcGIS ext or standalone tool • IDV client • Physical data • - temperature, salinity • Visualization: • Integrate data to define habitats • Data Ingest • - ASCII • - NetCDF • - Shapefiles • Transformation • From source to standard formats • User defined, iterative parameter ranges • Path of organism through habitat • Meteorological data • - Wind speed, insolation • Biological data • Fish catch abundance • Data Service • - THREDDS • ESRI FGDB • Larval track • Modeled using ROMS currents data • Statistical Analysis • - Hot spot analysis • Kriging • Mean center
ASA-IDV Data Connector • Ocean Model Data (ROMS) • Curvilinear grid • Single file • netCDF CF compliant • Works ‘out of the box’
ESRI Data Connections • Feature data readily ingested • Point, line & poly Physical Meteorological • Raster data readily ingested • Users specify data rendering with customized menus • Select and name variables Biological • Name and save • project files Particle (Larval) Track Ancillary (grid)
Analysis Capabilities • Shape characterization • Statistics • Landscape metrics • Fractal dimension • Mean center • Path of organism through habitat
Conclusions • Habitat determination is important for marine spatial planning and in determining climate impacts • GIS can provide tools to describe and model habitats in 3-D • IDV can be modified to provide visualization and analysis of habitats • Statistical tools for landscape metrics in 3-D still under development
For additional information contact: • Tiffany.C.Vance@noaa.gov • Guide to the ASA IDV plugin available • in the back. • Plugin available at www.asascience.com
Terrestrial Habitat for Ducklings http://www.ducks.ca/aboutduc/news/archives/2004/040531.html