Download
1 / 15
150 likes | 171 Vues
Study on long-term effects of nickel exposure in water ecosystems, indicating potential harm to phytoplankton and snails. Findings show pronounced effects at higher Ni concentrations. Evaluations based on NOEC determination and variability analysis.

E N D
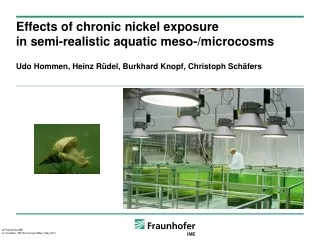
Effects of chronic nickel exposurein semi-realistic aquatic meso-/microcosms Udo Hommen, Heinz Rüdel, Burkhard Knopf, Christoph Schäfers
Test system • GLP study based on OECD and other guidance documents • 14 micro/mesocosms (1 m³) with a natural sediment / sand layer of 20 cm and an overlaying water volume of 750 L (tap water) • Located in a temperature-controlled greenhouse at the Fraunhofer IME • Colonization from sediment and samples from outdoor ponds, including taxa known to be sensitive to Ni exposure • Constant Ni exposure over 4 months (October 2009 - February 2010)
Summary in the study report • Intended Ni chronic exposure over four months was achieved (mean of measurements before daily Ni additions = 91 % of nominal) • Almost all of the measured total Ni concentrations was dissolved • At least 60 % of the total Ni in the water was bioavailable • Accumulation of Ni via the food was not relevant for the snails • Clear effects at 48 and 96 µg/L, on phytoplankton and the snails • Potential indirect effects on zooplankton, i.e. rotifers, and periphyton • Statistically significant deviations from controls up to 24 µg/L for three algae taxa at single sampling dates only: not considered as ecologically relevant considering the chronic exposure over 4 months • Thus, the study-specific long-term NOEC based on abundance is considered to be 24 µg/L (LOEC 48 µg/L). • If the decrease of snail abundance is considered as potentially related to the Ni exposure, a NOEC of 12 µg/L could be derived for this specific endpoint.
Example: phytoplankton community structure • Long-term deviations from controls at 96 µg/L and less pronounced and temporarily restricted deviations at 48 µg/L, slight deviations < 48 µg/L • No statistically significant deviations at 24 µg/L
Total snail abundance • Clear pronounced effects at 48 and 96 µg/L (quasi extinction) • Means of 6 to 24 µg/L always within or above the range of controls • NOEC for abundance = 24 µg/L (calculated by one-sided multiple Williams-test for each single sampling date, a = 5%,)
Concern on the interpretation of the snail data • cleareffectat 48 and 96 µg/L, but • high variabilitybeforestartofexposure • trendofdecrease in abundance also at12 and 24 µg/L • Thus, Nieffectsat< 48 µg/L? • 2 types of additional analysis by DEPA • Additional analysis by Fraunhofer • Two expert opinions
DEPA approach 1: significance of correlation • Rank correlation of means per treatment level and time(other data not available to DEPA at this time) • Significant negative correlation at 12 µg/L and higher • => DEPA conclusion: NOEC = 6 µg/L • However, the DEPA results seem to be strongly affected by one control cosm with a clear population growth and one replicate of 6 µg/L with almost no correlation • DEPA correlation of normalized data with same result
DEPA approach 2: Dose-response analysis for day 112 • Use of the mean measured abundance per treatment level on day 112 • Normalize to day 0 data • Linear regression to calculate EC10 of 6 µg/L respectively • Same analysis for predicted normalized abundance: EC10 = 6.3 µg/L • Linear regression is unusual for ECx calculation. Analysing the same data by probit analysis reveals an EC10 of 8.8 or 11 µg/L • EC10 applicable for these type of data? EC20 = 12.0 or 14 µg/L
Fraunhofer analysis based on the trend of population development in each mesocosm • Coefficients of determination R² Slopes = rates of population increase
Fraunhofer evaluation of the slope data • Williams-test applied to these slope reveals a NOEC of 12 µg/L (It does not matter if the outliers are excluded or not) • The slope corresponds to the rate r of exponential growth (or decrease): a population is stable if r = 0 • % effects can not be calculated if r<0 • Another option is the populationmultiplication rate l = er which can notfall below 0 • However, also for l ECx calculation is not possible because maximum effect < 5 % • NOEC for l is 12 µg/L (MDD% = 2 %) • Thus, based on this analysis, the NOEC is 12 µg/L
Additional thoughts on the snails • Variability was high, no doubt • Conditions for snails seem to have been not sufficient for good population development, maybe due to season (winter) or due to food limitation (reducing light and harvesting macrophytes to keep pH close to BLM range) • 12 and 24 µg/L with much higher abundance before exposure - food limitation could also be a reason for decrease of abundance in these mesocosms (populations falling back to the carrying capacity of the systems) • Generally low number of egg clutches found: 6 clutches in total in one control (C2) while no in the three other controls. However, one clutch was found on day 98 in one of the 24 μg Ni/L mesocosms indicating potential reproduction up to 24 µg/L • Snails were (semi-quantitatively) sampled for Ni analysis at the end of the study in the drained systems: Up to 24 µg/L the numbers were similar
Expertopinion by Prof. Bjarne Kjær Ersbøll, DTU • Focus on statistics of snail data (Statistician) • William’s test – at least at a first glance - seems sound – and seems to follow standard procedure. However, does not seem to incorporate neither the baseline measurements in any appropriate way, nor does it consider the repeated measurement structure of the data. • The baseline measurements (at days -11, -4, and 0) show significant differences between concentrations (including the controls as concentration 0). …The variation seen in the experiment is large. • DEPA analysis: The rather crude - but intriguing - analysis … strongly indicates that there might be somewhat different conclusions ... • Fraunhofer analysis (log-linear regression) That is certainly a possibility. However, I would still advocate for a repeated measures-type model (consider Time, Concentration, Tank as well as interactions Time - Conc. and including baseline measurements.) … : To my knowledge such a model is not “standard”. A model of the type proposed would take some time to develop.
Expert opinion by Dr. Theo Brock, Alterra, NL • Evaluation of the whole study, based on long experience with micro- and mesocosm studies (Ecotoxicologist) • Study considered suitable for risk assessment following the 5 criteria identified in EQS GD Section 3.3.1.3) with respect to • representativity of the test system, • experimental set-up, • exposure conditions, • species included, and • statistical evaluation • Weak point: Macrophyte measurements only at the end, macrophyte variability might have caused variability of other endpoints, e.g. snails. Observed differences in relative growth rate of (small) snails might either be a treatment-related effect of chronic nickel exposure or (at least in part) an artefact due to the sampling method • Unclear if snails were sampled quantitatively for Ni analysis at the end of the system (no, only semi-quantitatively)
Expert opinion by Dr. Theo Brock, Alterra, NL • Conclusions • On basisofthemost sensitive endpointsstudied (particularly relative growth rate dataofsnails) theoverallNOECmesocosmis 12 µg Ni/L . • Undertheassumptionthatclass 2 effects (slighteffects on a singleisolatedsamplingday) on themost sensitive measurementendpointsareacceptable in chronicmodelecosystemstudies, a study-specificoverallthresholdlevelconcentrationmightbesetat 24 µg Ni/L, at least if additional dataareprovideddemonstratingthattheeffectsobservedfor relative growth rate ofsnailsare an artefactofthesamplingmethod.
Our conclusions • The study is valid and suitable for risk assessment. • The proposed NOEC of 12 µg/L is based on best available statistical analysis of the snail data. • There are significant differences in snail abundance on day 0 but at the end of study no significant differences to controls up to 24 µg/L • The difference between the trend of population development at 24 µg/L and in the controls was statistical significant but only small (for l < 5%). • Due to suboptimal conditions for the snails and variability between tanks before start of exposure, effects at 24 µg/L could also be caused by other factors than Ni. • Thus, the NOEC of 12 µg/L is considered reliable and precautious. • The HC5 of the SSD corrected for the given water conditions (by Ni-BLM) was between 4.2 to 6.8 µg/L. • Thus, this HC5 was protective for the community tested in the mesocosms.