Download
1 / 39
390 likes | 587 Vues
Evaluation of Incorporating Hybrid Vehicle Use of HOV Lanes. Lianyu Chu CLR Analytics Inc July 14, 2008 @ NA Paramics User Group Meeting. Background. Many states have demonstrated the effectiveness of HOV lanes HOV lane operation is criticized Underutilization of roadway capacity

E N D
Evaluation of Incorporating Hybrid Vehicle Use of HOV Lanes Lianyu Chu CLR Analytics Inc July 14, 2008 @ NA Paramics User Group Meeting
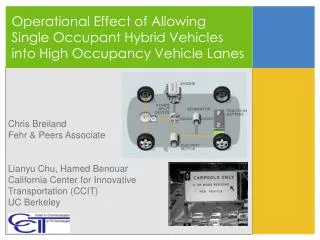
Background • Many states have demonstrated the effectiveness of HOV lanes • HOV lane operation is criticized • Underutilization of roadway capacity • Limited ability to shift solo drivers to transit and carpools • Conversion to other type of operation • Allowing single occupant hybrid vehicles (SOHV) • In southern California • From buffer separate to continuous access • HOT
HOV lanes • What is HOV lane? • Northern CA • Continuous access • Operated during peak periods • HOV 2+ or 3+ • Southern CA • Limited access • Operated 24 hours a day • HOV 2+ • HOV lanes in CA • About 30% of the total of US
Current Hybrid HOV policy in California • Starting Jan 2005 • Stickers will expire in 2010. • Vehicle models > 45 miles per gallon • Toyota Prius • Hybrid Honda Civic • Honda Insight • Maximum number of stickers • Originally, 75K, • reached at Nov 2006 • Then, decided to offer 10K more • Reaches 85K on 2/2/2007 • No more stickers
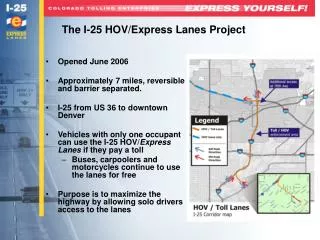
Motivation • Statewide policy • San Francisco Bay Area • there is substantial reserve capacity on HOV lanes • Orange County, • HOV lanes have almost reached their nominal capacity of 1,650 vehicles per hour, carrying an average of 1,568 vph in 1998 • Purpose: • Investigate impacts of the policy in OC • Operational effects • Emission effects
Select study site Build micro-simulation model in Paramics Estimate SOV / HOV demand Calibrate micro-simulation model Planning model Estimate hybrid demand Socio-economic characteristics & Hybrid Population Data Run simulation for each scenario Design scenario Policy Performance measures Compare simulation results Policy Implications Methodology
Model • All major freeways • I-5, I-405, SR-55, SR-22, SR-57, and SR-91 • Most freeway mainline have 4-6 lanes • Excluding 6-mile the southern part of I-5, the section of SR-91 express lane. • Model summary • 200 HOV lane miles • 800 mainline lane miles • Total zones: 265 • AM Peak hour model
HOV lane modeling • Network construction (buffer-separated HOV) • The mixed-flow lanes and HOV lanes were coded as two separate links wherever required. • Non-buffered sections were coded as a single link between ingress and egress points. • Route choice models • Combination of the use of three routing models • All-or-nothing • Stochastic route choice • Dynamic feedback
Calibration data preparation and data analysis Initial calibration / setting of route choice models OD demand estimation Route choice modification Network performance calibration and validation Final model Model calibration
Calibration data preparation • Base year: 2005 • Both flow and speed data were collected from PeMS • Flow data: • Gather data from four different years (2002-2005) • Some on-ramp and off-ramp locations • estimated based on Caltrans census dataset or mainline data • Speed data • 5-min speed data were collected from freeways for 3 months • Draw the 50th percentile speed contour maps based on Tuesday to Thursday’s data • Used to identify freeway bottlenecks.
Demand Estimation • Pattern OD matrix • OCTAM: planning model of Orange County, CA • Extracted using MMA analysis in TransCAD • Fine-tune OD matrix using Paramics OD estimator • HOV demand estimation • A fixed percentage: 21.7% • Based on California DOT’s HOV report and loop detector data • Trial-and-error based on range from 14% to 25% • Hybrid demand estimation model : • Estimate each zone’s hybrid percentage • Multinomial regression and binomial regression model • Social-economic data • Survey data
HOV volume / total volume (based on 2005 D12 HOV report) • HOV volume / total volume percentage: • peak period: 10.2% - 23.1% • peak hour: 11.4% - 25% • Patterns: • HOV lanes attract more carpoolers since HOV lane is faster • Congested areas: higher percentages
Model Calibration/Validations • Data for baseline model calibration • - End of 2004 data from PeMS
5NB HOV Speed Contour: Observed 5NB HOV Speed Contour: Simulated
5SB HOV Speed Contour: Observed 5SB HOV Speed Contour: Simulated
405NB HOV Speed Contour: Observed 405NB HOV Speed Contour: Simulated
405SB HOV Speed Contour:Simulated 405SB HOV Speed Contour: Observed
55NB HOV Speed Contour: Observed 55NB HOV Speed Contour: Simulated
55SB HOV Speed Contour: Observed 55SB HOV Speed Contour: Simulated
57SB HOV Speed Contour: Observed 57SB HOV Speed Contour: Simulated
Scenario Construction • Base Case: • No Hybrids allowed on HOV lanes • before California’s bill AB 2628 passed • Scenario 1: • 36K Hybrids in CA (Nov 2005) • 3707 of 36K hybrids in OC • Scenario 2: • 50K Hybrids (April 2006) • 5216 of 50K hybrids in OC • Scenario 3: • 75K Hybrids (Nov 2006) • Scenario 4: • 100K Hybrid (near future) • * Total trips for study network: 238K • DMV data show: • About 10% of CA hybrids are in OC
Performance Measures • Overall network performance measures: • Vehicle Hours Traveled (VHT) • Vehicle Miles Traveled (VMT) • Corridor performance measures: • Average corridor speed • Speed • SAFETEA-LU needs HOV lanes to keep speed higher than 45 mph for 90% of the peak periods • LOS • Caltrans has the authority to remove “individual HOV lanes or portions of those lanes,” if traffic condition exceeds LOS C. • Emissions & Fuel consumptions • Comprehensive Modal Emission Model (CMEM) from UC Riverside • second-by-second emissions
HOV Segments for further analysis • Total 43 HOV sections • Study period: 5minutes (for 1-hour data)
Simulation design • Assuming no HOV lane violations during simulation. • Simulations period • One peak hour in AM • Simulate for 1 hour and 30 minutes. • The first 30 minutes of simulation: warm-up period • MOE • Collected using different plug-ins • Only the last one hour of the simulations were analyzed. • Base scenario • used as reference to evaluate other scenarios. • Five runs were conducted per scenario • The results from the median run are used for analysis.
Overall Network Performance Confidence interval for the comparison
Speed Distribution: HOV sections • With more traffic allowed into HOV lanes, HOV lane performance degrades
Percentage of Sections & Time periods withspeed greater than 45 mph
Percentage of Sections & Time spent less than 26 veh/mile/lane (LOS C)
Comparison of Emissions • Scenario 4 reduces emissions significantly • due to high share of Hybrids
Policy decision: multi-objective optimization problem • Maximize the benefits obtained from emission • SC4 is the best • Meet FHWA’s SAFETEA-LU’s requirement. • Base-year: doesn’t meet • Practical: allow another 10% HOV lanes to be under 45 mph • SC1-3 can meet • HOV lanes must continue to provide benefits for existing carpoolers. • MOE: percentage of ave. speed difference between HOV & mixed-flow lanes • Speed difference in Sc1-SC3 are 21%, 16% and 11%. • An intuitive feeling : at least 15% speed difference • SC1-2 meet • Scenario 2 appears likely to satisfy the desires of all stakeholders.
Findings • With the increase of Hybrids, the operational performance of HOV lanes degrades • Overall, Scenario 2 performs more effectively (50K hybrid) • HOV lane speed is reduced by less than 5% in scenario 2 • From air quality perspective, scenario 4 (100K hybrids) outperforms. • Hybrid HOV policy may have impacted sales of Hybrid vehicles • April 2006: 50K • Nov 2006: 75K • Feb 2, 2007: 85K
Policy Implication • The policy is successful in reducing emission by allowing hybrid vehicles using HOV lanes. • The policy is not appropriate to be applied to the HOV lanes that don’t have reserved capacity. • 50K hybrid vehicle permits (SC2) throughout the state could be the maximum that the Orange County HOV system can take without much degradation. • The policy could have been implemented more strategically, i.e. applying to selected freeways and/or selected time periods.
Project team • CCIT, UC Berkeley • Lianyu Chu • UC Irvine • Will Recker • David Brownstone • Tom Golob • K S Nesamani • Chris Breiland • Western Michigan University • Jun Seok Oh
Thank you! Questions & Comments