Download
1 / 15
150 likes | 275 Vues
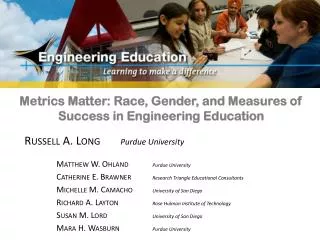
Race, Gender, and Measures of Success in Engineering Education. Russell A. Long Purdue University Matthew W. Ohland Purdue University Catherine E. Brawner Research Triangle Educational Consultants Michelle M. Camacho University of San Diego

E N D
Race, Gender, and Measures of Success in Engineering Education Russell A. LongPurdue University Matthew W. OhlandPurdue University Catherine E. BrawnerResearch Triangle Educational Consultants Michelle M. CamachoUniversity of San Diego Richard A. Layton Rose Hulman Institute of Technology Susan M. LordUniversity of San Diego Mara H. WasburnPurdue University
Background This paper is one of a series of works using a large multi-institution dataset to fuel critical conversations in engineering education. Earlier works have revealed that : • Women and men who matriculate in engineering are more likely to persist in engineering than students in other majors (Ohland et al., 2008); • For all races except Native American, women who matriculate in engineering persist to the eighth semester at rates comparable to those of men (Lord et al., 2009); • The metric used to measure success matters. While eight-semester persistence in engineering is a reasonable predictor of six-year graduation in engineering in the aggregate, institutional differences are noticeable and much greater than variation by gender (Ohland, Camacho, Layton, Lord, & Wasburn, 2009); • Institutional variation in persistence, as measured by either eight-semester persistence or six-year graduation, is much greater than the variation by gender (Ohland et al., 2009).
Design/Method The eight-semester persistence and six-year graduation rate are compared for various race-gender populations using MIDFIELD. The Multi-Institution Database for Investigating Engineering Longitudinal Development (MIDFIELD). contains records for 75,686 first-time-in-college students matriculating in engineering from 1988 through 1998, excluding international students and also excluding students who self-identified as a race other than Asian, Black, Hispanic, Native American, or White (Long, 2008; Ohland et al., 2008). The MIDFIELD schools are all public institutions in the southeastern United States, yet their size and diversity help make the results generalizable.
Nine MIDFIELD Institutions 6 of the 50 largest U.S. undergraduate engineering programs. 1/12 of all U.S. engineering undergraduate degrees. 1988-1998 cohorts include 19,000 (21.5%) female engineering students. 1/5 of all U.S. African-American engineering B.S. degree recipients each year. Graduation percentage of Hispanics (regardless of gender) is representative of other U.S. programs. All other ethnic populations are representative of a national sample.
Eight-Semester Persistence The number or percentage of students matriculating in any engineering discipline who are still enrolled in an engineering discipline in their eighth semester (although not necessarily in the engineering discipline in which they originally matriculated). Notably, only enrolled semesters are counted, so the number of semesters does not precisely map to the chronology of the student’s enrollment.
Six-Year Graduation The number or percentage of students matriculating in any engineering discipline who have graduated in any engineering discipline within six chronological years (again, not necessarily from the engineering discipline in which they matriculated). In this case, a student matriculating in engineering during fall 1998 must have graduated from engineering in the summer of 2004 or sooner to be counted.
Yield The number of students graduating within six chronological years as a percentage of those students who persist to eight semesters. Here, we neglect the small confusion introduced by students who persist to eight semesters, but take longer than six years to do so. The product of the yield and the eight-semester persistence is the six-year graduation rate.
At first, eight-semester persistence in engineering appears to be a consistent predictor of six-year graduation.
Female and male populations aggregated by race with similar graduation rates may have widely varying experiences. Numbers represent institutions; filled circles are female populations. Note that institutional differences outweigh gender differences.
Black students only. Numbers represent institutions, filled circles are female populations.
Systematic Majority Measurement Bias The characteristic relationship between eight-semester persistence and six-year graduation is most strongly observed in Asians and Whites, leading to a bias in interpreting aggregated persistence data since these two populations together account for 82 percent of the total undergraduate engineering population in MIDFIELD and hence mask the performance of the underrepresented populations. We refer to this as a “systematic majority measurement bias” (SMMB). SMMB causes an underreporting of the variability of both metrics and an over-reporting of the correlation of eight-semester persistence and six-year graduation.
Conclusions At all institutions, women who persist to the eighth semester are more likely to graduate than men who persist to the eighth semester. Using eight-semester persistence as a success metric can underreport the persistence of women to graduation. This is true for all aggregated populations of women and many racial subpopulations. While we have demonstrated that persistence varies by institution, presumably because of institutional recruitment and retention practices, within each institution it is clear that an eight semester metric belies six year graduation persistence.
Conclusions Eight semester persistence metrics that do not disaggregate by race conflate data that heavily over-represents white males. These produce data that suggest men outpace their gendered counterparts at the eighth semester marker. Following these students to six year graduation, and disaggregating by race and gender, reveals that women in several racial/ethnic groups graduate at a higher rate. Ultimately, our work demonstrates that trajectories of persistence are non-linear, gendered, and racialized, and further that higher education has developed the way in which persistence is studied based on the behavior of the majority, specifically the White, male population.
Acknowledgements This material is based on work supported by the National Science Foundation Grant No. REC-0337629 (now DRL- 0729596) and EEC-0646441, funding the Multiple-Institution Database for Investigating Engineering Longitudinal Development (MIDFIELD, a collaboration of nine partner universities) and a collaborative NSF Gender in Science and Engineering Research Grant (0734085 & 0734062). The opinions expressed in this article are those of the authors and do not necessarily reflect the views of the National Science Foundation.