Download

1 / 35
350 likes | 442 Vues
Explore the financial highlights, performance indicators, and strategic initiatives of a company for the first half of 2004, featuring earnings per share, dividends, revenue growth, and more.

E N D
Interim results presentationFor the period ended 31 March 2004
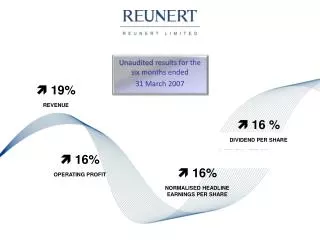
Features • Headline earnings per share of 69,2 cents vs 67,6 cents • Headline earnings of R326,9 m vs R331,6 m • Return on equity of 27,4% vs 25,9% and return on assets of 10,5% vs 10,3% • Interim dividend increased to 35 cents from 25 cents • Free cash reserves of R723 m
Features • Increased sales and improved margins lift total revenues • Credit performance and market conditions remain positive • Cost reduction initiatives proving successful with furtherbenefits expected in second half • Profit before tax up 16% from R522 million to R607 million • R60 million STC on special dividend increases total tax charge from 37% to 47%
RoA and RoE Return on assets Return on equity
Features Impact of changes in drivers on earnings Deterioration Improvement Interest-bearing assets Total yield Revenue Bad debts Operating costs Net funding costs Net income before taxation Value added tax and STC Taxation Net income after taxation
Features Impact of changes in drivers on earnings Deterioration Improvement Interest-bearing assets Total yield Revenue Bad debts Operating costs Net funding costs Net income before taxation Value added tax and STC Taxation Net income after taxation
Features Impact of changes in drivers on earnings Deterioration Improvement Interest-bearing assets Total yield Revenue Bad debts Operating costs Net funding costs Net income before taxation Value added tax and STC Taxation Net income after taxation
6 mths ended 31 Mar 04 6 mths ended 30 Sep 03 6 mths ended 31 Mar 03 Bad debts/margin Bad debts/margin Bad debts/margin 48,2% 44,7% 40,3% 19,3% 19,8% 19,0% 5,5% 5,0% 4,1% 33,5% 34,9% 37,4% Cost/income Cost/income Cost/income 5,7% 5,6% 6,3% 59,5% 55,4% 50,7% less less less (9,3%) (8,8%) (7,7%) (19,9%) (19,3%) (19,0%) (6,5%) (6,0%) (5,9%) 23,8% 21,3% 18,3% equals equals equals less less less 46,8% 38,1% 36,7% 12,7% 13,2% 11,5% equals equals equals less less less (2,1%) (2,4%) (1,2%) equals equals equals 10,5% 10,8% 10,3% multiply multiply multiply 2,6 2,5 2,4 equals equals equals 27,4% 25,8% 25,9% RoE model Margin/advances Assurance/advances Other income/advances Total yield Bad debts/advances Opex/advances Financing costs/advances Operating margin Tax rate Advances/total assets Return on assets Gearing Return on equity
31 March 2003 31 March 2004 Segmental earnings
Advances, sales and clients Advances analysis
Advances, sales and clients Gross interest-bearing advances
Advances, sales and clients Gross advances portfolio mix
Advances, sales and clients Sales history Rm
Advances, sales and clients Clients • Sales for six months increased by 34% to R2 197 m • African Bank Retail (up 35%) • 32% increase in number of loans • 2% increase in loan size • Specialised Lending (up 32%) • 4% decrease in number of loans • 38% increase in loan size • 710 000 new loans advanced
Advances, sales and clients Price differentiation • Stage 1 – 3rd quarter 2003 differential between highest and lowest interest rate increased by further 9% to 27% • Stage 2 – 3rd quarter 2004 new scoring models incorporating behavioural, operational and individual risk information and a new set of products
Underwriting margin and costs Operating margin analysis Total yield After tax operating margins Charge for bad debts % average gross interest-bearing advances Operating expenses Net financing costs Tax charges
Underwriting margin and costs Cost-to-income ratio
Asset quality – NPLs and provisions Advances and provisions analysis
Asset quality – NPLs and provisions Bad debt charge
Asset quality – NPLs and provisions Advances and provisions analysis
Asset quality – NPLs and provisions Vintage chart for African Bank Retail VINTAGE GRAPH – African Bank RetailMore than two instalments missed Non-performing loans as % oforiginal principal debt Months on book
Asset quality – NPLs and provisions Collections • AC133: NPLs are valued at the present value of future cash flows Rm Non-performing loans 2 419 Less provisions (1 800) Residual NPLs (NAV) 620 • R162,3 million collected in African Bank Retail in last 6 months • annualised 52,3% of residual NPLs (nominal) or • average 30 months to collect residual NPLs (NPV)
Sept 2002 March 2003 Sept 2003 March 2004 Capital, cash flow and funding Capital adequacy CA-Ratings credit rating affirmed May 2004: A– (long-term) A1 (short-term)
Capital, cash flow and funding Capital adequacy model * Three times average bad debt charge
Capital, cash flow and funding Maturity profile of assets and liabilities Free cash reserves of R723 million
Capital, cash flow and funding Cash flow analysis
Regulatory changes Credit law review – summary of proposed framework • Usury Act and Credit Agreements Act to be replaced • Independent regulatory body to be established • Consumer protection to be improved • Improve disclosure of cost of credit • Prohibit undesirable credit terms and practices • Regulate the behaviour of intermediaries • Consumer education to be improved • Complaints resolution and debt counselling framework to be implemented • Provisions on reckless lending to be introduced • Credit bureau activity to be regulated • Weaknesses in regulation of debt collection to be addressed
Looking ahead • Sales growth to outpace the decline in the paydown books • Gross margins to increase moderately based on changes to portfolio mix • Bad debt charges steady at current levels • Operating costs to benefit from initiatives implemented • Continued focus on optimal capital levels The outlook for both RoA and RoE remain positive.