Variation in mathematics performance
50 likes | 200 Vues
This analysis explores the factors affecting variation in mathematics performance across schools, highlighting differences both within and between institutions. It draws on OECD data (2004) to illustrate how socio-economic status (SES) significantly influences student achievement, with notable disparities observed in countries like Korea, Germany, and Japan. The findings reveal that a substantial 66% of performance variation is attributable to students' socio-economic backgrounds, impacting their educational experiences and outcomes. Understanding these dynamics is essential for addressing educational inequalities.

Variation in mathematics performance
E N D
Presentation Transcript
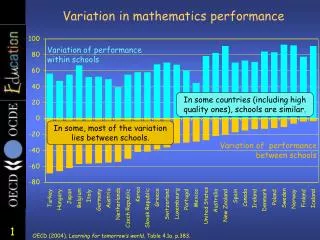
Variation in mathematics performance Variation of performance within schools In some countries (including high quality ones), schools are similar. In some, most of the variation lies between schools. Variation of performance between schools OECD (2004), Learning for tomorrow’s world, Table 4.1a, p.383.
Variation in mathematics performance Variation of performance within schools Variation of performance between schools Variation explained by socio-economic level of students and schools (66% for Korea) OECD (2004), Learning for tomorrow’s world, Table 4.1a, p.383.
Countries differ in relationship between student grouping and social background:Mathematics (PISA 2003)
Student performance and SES - overall School performance and SES Student performance and SES - within schools School: point proportional to size Mathematics vs social background - Germany High Mathematics performance Low Disadvantage Advantage PISA Index of social background OECD (2004), Learning for tomorrow’s world, Figure 4.13, pp.199-203.
Student performance and SES - overall School performance and SES Student performance and SES - within schools School: point proportional to size Mathematics vs social background - Japan High Mathematics performance Low Disadvantage Advantage PISA Index of social background OECD (2004), Learning for tomorrow’s world, Figure 4.13, pp.199-203.