Download
1 / 42
420 likes | 585 Vues
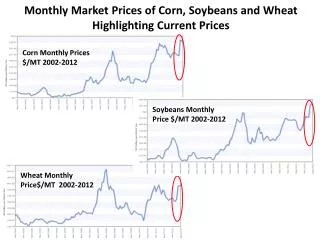
Commodity Situation and Outlook (Corn, Wheat, Soybeans, and Livestock). National Turkey Federation Westin Hotel, Washington, DC October 24, 2011 http://www.usda.gov/oce/speeches/index.htm. World Corn Production. U.S. Corn Supply and Use 2010 Estimate and 2011/12 Forecasts.

E N D
Commodity Situation and Outlook(Corn, Wheat, Soybeans, and Livestock) National Turkey Federation Westin Hotel, Washington, DC October 24, 2011 http://www.usda.gov/oce/speeches/index.htm
World Corn Production October 12, 2011
Renewable Fuel Standard Source: Energy Independence and Security Act of 2007.
U.S. Ethanol Production Capacity 2011 2012 2010 2009 2008 2007 2006 Source: Production capacity from Renewable Fuels Association. RFS from Energy Independence and Security Act of 2007.
U.S. Blended Motor Gasoline Consumption 7.6 bil. gal. 5.3 bil. gal. Source: DOE-Energy Information Administration, Short-term Energy Outlook (STEO) and Annual Energy Outlook (AEO).
Ethanol Producer Net Returns Above Variable Costs / Spot prices + 39 cents / gal. (10/14/11) Note: USDA-WAOB estimates based on USDA-AMS plant reports and DOE-EIA estimates and forecasts for natural gas and electricity prices.
Ethanol and RBOB Nearby Futures Prices Reformulate Gasoline Blend Stock (RBOB) $0.12 Ethanol Note: Ethanol prices based on CBOT nearby futures. RBOB (Reformulated Gasoline Blend Stock) based on NYME nearby futures.
Ethanol and RBOB Nearby Futures Spreads 45-cent blender credit Blending incentive (10/13/11) = $0.57 (Ethanol – RBOB) Note: Ethanol prices based on CBOT nearby futures. RBOB (Reformulated Gasoline Blend Stock) based on NYME nearby futures.
World Wheat Production October 12, 2011
U.S. Wheat Supply and Demand October 12, 2011
World Soybean Production October 12, 2011
U.S. Soybeans Supply and Use2010 Estimate and 2011/12 Forecasts
China Soybean Imports Million Tons 56.5 million tons
U.S. Soybean Meal Supply and Demand October 12, 2011
U.S. Soybean Oil Supply and Demand October 12, 2011
Soybean Meal Prices 1995 - 2011 Dollars per ton
Soybean Oil Prices 1995 - 2011 Cents per pound
Soybean/Corn Price Ratio ratio 2.10 1.92
U.S. Meat Production and Prices October 12, 2011
U.S. Meat TradeMillion Pounds October 12, 2011
World Cotton Production October 12, 2011
U.S. Cotton Supply and Demand October 12, 2011
END (Summary Tables Follow)
Production Summary October 12, 2011
Domestic Demand Summary October 12, 2011
U.S. Export Summary October 12, 2011
Price Summary October 12, 2011