Download
1 / 30
300 likes | 418 Vues
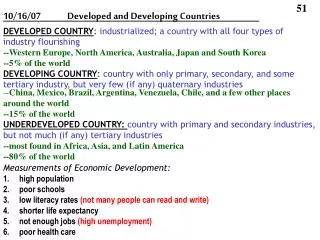
This workshop held in Bali, Indonesia, on November 29-30, 2007, delves into emissions data and trends observed in both developed and developing nations. Key sources of data include reports from UNFCCC, IPCC, IEA, and CAIT, analyzing greenhouse gas emissions across various countries and identifying growth patterns. Findings reveal that emissions growth is highest among developing countries, shaped by factors such as GDP, population, and energy use. Understanding these trends is crucial for LDC negotiators in the context of international climate discussions.

E N D
Emissions Data and Trends from Developed and Developing Countries ______________ Pre COP Workshop for LDC Negotiators 29-30 November 2007 Bali, Indonesia Ilona Millar FIELD
Where does the Data come from? • UNFCCC • National Greenhouse Gas Inventories (FCCC/SBI/2007/30) • National Communications from Annex I Parties (FCCC/SBI/2007/INF.6 & add.1) • National communications from Non-Annex I Parties (FCCC/SBI/2005/18/Add.2) • IPCC • IEA • WRI • CAIT • Earth Trends • Navigating the Numbers
Annex I Trends • Excluding LULUCF • Total AI -2.8% • EIT -35.2% • Non-EIT +11% • Including LULUCF • Total AI -4.6% • EIT -36.2% • Non-EIT +10%
Annex I Trends including LULUCF • 1990-1995 • Fell 6.9% • 1995-2000 • Rose 1.3% • 2000-2004 • Rose 2.4%
Ex LULUCF Australia +25.6 Canada +25.3 USA +16.3 Japan +6.9 EU -1.5 UK -14 Germany -18 Incl LULUCF Australia +4.9 Canada +54.2 USA +18.4 Japan +7.4 EU -4 UK -15.4 Germany -19.5 Changes in AI emissions 1990-2005
Non-Annex I Emissions as reported based on best available data in 2005
Non-AI emissionsGgtonnes CO2e • Botswana 9,291 -29,441 • Congo 1,374 -68,485 • China 4,057,306 3,649,827 • India 1,214,248 1,228,540 • Indonesia 323,262 487,380
Figure 2.3. Aggregate Contributions of Major GHG Emitting Countries
Cumulative CO2 Emissions, Comparison of Different Time Periods
What are the trends? • Global growth in emissions • Growth rates highest among developing countries • Contributing factors – GDP/Capita, Population, Energy intensity, Fuel mix
% Percent change from 2000 Figure 3.1 WRI. Projected Emissions of GHGs in 2025
(Stabilization Scenarios from WGIII, 4 May 2007, Figure SPM 5)
FIELD www.field.org.uk ilona.millar@field.org.uk Tel: +44 20 7388-2117 Fax: +44 20 7388-2826 3 Endsleigh Street London WC1H 0DD United Kingdom