Analysis of the Pinehaven/Caughlin Ranch Fire: July 2, 2012
The Pinehaven/Caughlin Ranch Fire ignited on July 2, 2012, around 1 PM local time, suspected to be caused by arson. Initially, fewer than 100 acres were burning when firefighters arrived. By July 3, containment reached 90%, with a total of 206 acres burned by the end. This report analyzes the fire using AERONET data, MODIS, and CALIPSO satellite imagery, alongside dispersion characteristics from the HYSPLIT model. The study highlights limitations in remote sensing and suggests future improvements in satellite data accuracy for monitoring fire events.

Analysis of the Pinehaven/Caughlin Ranch Fire: July 2, 2012
E N D
Presentation Transcript
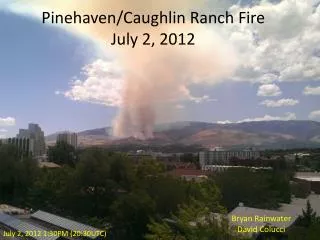
Pinehaven/Caughlin Ranch FireJuly 2, 2012 Bryan Rainwater David Colucci July 2, 2012 1:30PM (20:30UTC)
Objectives • Observe the Pinehaven/Caughlin Ranch Fire beginning on July 2, 2012 at about 1PM local time. • Analyze the University of Nevada AERONET data that intersects the smoke plume. • Acquire and analyze MODIS and CALIPSO data. • Acquire dispersion characteristics from the HYSPLIT model with the NAM12K meteorological data and verify accuracy using on site LIDAR and CIMEL readings.
Pinehaven/Caughlin Ranch Fire • July 2, 1:00PM • fire started from suspected arson according to fire officials. • July 2, 1:30PM • Fire crews arrived on site with under 100 acres burning • July 2, 4:30PM • containment had been mostly achieved, with an estimated 200 acres burned. • July 3, 9:15AM • fire crews achieved 90 percent containment. • July 3, 1:30PM • fire had been fully contained having burned 206 acres. July 2, 2012 1:22PM *Photo Courtesy of Ben Sumlin
Satellite Imagery of the Fire Terra Sensor
Modis Terra Satellite Image July 2, 2012 (11:10AM) Modis Aqua Satellite Image July 2, 2012 (2:30PM)
CALIPSO LIDAROrbital Path July 3, 2012 July 2, 2012
Satellite Remote Sensing Limitations (in sight of recent developments) • Lack of necessary pixels, appropriate resolution, or swath size. • Algorithm Errors that lead to problematic data. • Inability to continuously correct for surface and ocean albedo, elevation gradients, ocean glint • Vertical resolution needs improvement on current sensors. • Inability to identify vertical distribution of atmospheric components (unless intersected by CALIPSO) • Several sensors are far past their predicted lifetime and working (but for how long?) • Sensors are experiencing losses of data (OMI) • Sensors will fall out of orbit eventually though some sooner than others (PARASOL)
Future Improvements • Numerous scientific programs and teams are working on independent algorithm corrections and model improvements. • Computer processing limitations are being overcome • Remote sensing understanding is constantly improving • Algorithms for pixel “smoothing” are being worked on • Help in understanding vertical resolution is being worked on • Levels of data processing are constantly improving to allow for additional land, ocean, atmosphere, climate, etc. products. • Correlating ground and satellite based sensors data • Incorporating local meteorological data • More sensors will be lunched for additional and improved satellite data
Future Improvements/Missions Blue – ESA sensors Red – Japanese sensor Green – Geostationary Taken from NASA ARSET Webinar Series Presentations
Conclusions • CIMEL level 1 data proved to be reliable to study the smoke plume passing through the column • Limitations of Remote Sensing • Lack of CALIPSO data • Smear of AOD data across a large area via MODIS • Lack of reliable AOD pixels • Inability to recognize smoke on both CIMEL data and on MODIS imagery • Lack of resolution for relatively small scale burn events (206 acre fire) • HYSPLIT’s Dispersion Model passed over the University for the time in which we physically observed smoke • The Smoke Verification Tool is very rough when compared with the HYSPLIT Dispersion Model