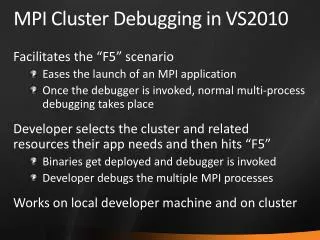
Debugging Cluster Programs
Debugging parallel programs can be challenging, but utilizing symbolic debuggers and strategic coding practices can significantly simplify the process. Start by carefully reviewing your code, using print statements, and adding debugging code at critical locations. Leverage tools like GDB for real-time monitoring and to inspect variable values. Familiarize yourself with common error sources, such as pointer misuse and deadlock scenarios. Collaborating with peers can also provide fresh perspectives. Incorporate these techniques to enhance your debugging skills and improve code reliability.

Debugging Cluster Programs
E N D
Presentation Transcript
Debugging Cluster Programs using symbolic debuggers
Debugging Code • Careful review of your code • Add debugging code to your code • print statements at strategic locations in code • remove later • Use a symbolic debugger
Careful review of your code • Rereading your code is often helpful • Most parallel code errors are serial errors • Compare your code to specs • Take a break, review your code with a fresh brain • Have someone else help you review your code
Common sources of errors • Beyond what the compiler catches • Usually run-time errors • Incorrect use of pointers • Point out of memory • Reference should have used a pointer • Referenced wrong variable • Index initialized wrong, wrong exit condition
Common parallel errors • Deadlock errors • Receive before send • Receive, but no send • Incorrect arguments in MPI calls • Mismatch on tags • Mismatch of source/destination • Misunderstanding of a the use of an argument
Add Debugging Code • Add strategically placed code in your code to display critical information • Watch values of variables as the program progresses • Can create data-dump functions – call when you need them • Have a way to remove them in production code
Add Debugging Code • Can be difficult to get the right debugging code in the right place • Does not scale well in parallel environment • Can produce unmanageable or unintelligible output
Symbolic Debuggers • Allow you to – • inspect your code • monitor its behavior • modify the data values • on the fly – as your code executes
Frequently used GDB commands: break [file:]function - Set a breakpoint at function (in file). run [arglist] - Start your program (with arglist, if specified). bt - Backtrace: display the program stack. print expr - Display the value of an expression. c - Continue running your program (after stopping, e.g. at a breakpoint). next - Execute next program line (after stopping); step over any function calls in the line. step - Execute next program line (after stopping); step into any function calls in the line. help [name] - Show information about GDB command name, or general information about using GDB. quit - Exit from GDB.
Running in X-windows • Linux (Unix) to Linux • ssh to host, login and enter X application • Other platforms (Windows, Mac) – Use X-windows server application • VNC • in most platforms VNC operates as a remote control application • in Linux VNC operates as a X-windows server • viewer for Windows, Macintosh, Solaris
Running in X-windows • Using VNC • ssh to host and login • start vncserver • pay attention to display id (:n) • from your desktop run VNCViewer • select host with correct display id • After session kill vncserver – • vncserver –kill :n (n is display id number)
pgdbg • Debugger from the Portland Group (PGI) • Can use with PG compilers • Can use with GNU compilers
pgdbg – common commands Back to text mode for a bit lis[t] [count | low:high | routine | line,count] -display lines from the source code file or routine att[ach] <pid> [<exe> | <exe> <host>] - attach to a running process <pid> or start a local executable and attach to it, or start an executable <exe> on <host> c[ont] - continue executing from the current location
pgdbg – common commands det[ach] – detach from the currently attached process halt – halt the executing process or thread n[ext] [count] – continue executing and stop after count lines of source code nexti [count] – continue executing and stop after count instructions
pgdbg – common commands q[uit] – terminate pgdbg and exit ru[n] [arg0 arg1 … argn] – run program from beginning with arguments arg0, arg1… s[tep] [count] – execute next count lines of source code and stop. Step steps into called routines s[tep] up – steps out of current routine stepi [count] – execute next count instructions and stop. Steps into called routines
pgdbg – common commands stepi up – steps out of current routine and stops Event command – break line | function - sets a break point to specified line or function. If no line or function specified lists existing breakpoints. A break point stops execution at specified point clear [all | line | func] – clears all breakpoints, or a breakpoint at line line or at function func.
pgdbg – common commands stop var - break when the value of var changes at a location watch expr – stops and display the value of expr when it changes track expr – like watch except does not stop execution trace var - displays a trace of source line execution when the value of var changes
pgdbg – common commands p[rint] var – displays the value of a variable edit filename – evokes an editor to edit file filename. If no filename given edits current file decl[aration name – displays the type declaration for the object name as[ign] var = expr - assigns the value expr to the variable var proc [number] – sets the current process to process number number
Resources • gdb • man gdb • info gdb; Using GDB: A Guide to the GNU Source- • Level Debugger, Richard M. Stallman and Roland H. Pesch, July 1991. • ddd • man ddd • VNC • http://www.uk.research.att.com/vnc/ • http://www.realvnc.com
Resources • PGI Debugger User’s Guide http://www.pgroup.com/ppro_docs/pgdbg_ug/PGDBG4.htm • PGI Users Guide, PGI 4.1 Release Notes, FAQ, Tutorials http://www.pgroup.com/docs.htm • MPI-CH http://www.netlib.org/ • OpenMP http://www.openmp.org/ • HPDF (High Performance Debugging Forum) Standard http://www.ptools.org/hpdf/draft/intro.html