Download
1 / 19
190 likes | 322 Vues
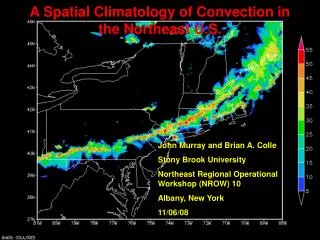
Northeast/AWT Widespread rains from 7 Dec 2011. Slow-moving surface low eventually accelerated through the Northeast Some heavy rainfall, particularly after 18z and 00z/8 Dec Looked at set of runs from 12z/7 Dec and 18z/7 Dec. And precipitation only from 00z/8 Dec

E N D
Northeast/AWT Widespread rains from 7 Dec 2011 Slow-moving surface low eventually accelerated through the Northeast Some heavy rainfall, particularly after 18z and 00z/8 Dec Looked at set of runs from 12z/7 Dec and 18z/7 Dec. And precipitation only from 00z/8 Dec LAPS_CI, STMAS_CI, STMAS_CI_CYC and HRRR So far have assembled the 12z/7 Dec comparisons Some observations See notes on the slides For this case the HRRR seems to catch up quickly. LAPS and STMAS configurations LAPS_CI = ewp1 is the LAPS initialized WRF run STMAS_CI = wsm6 is STMAS initialized new version of WRF run testing ingest of STMAS vertical omega STMAS_CI_CYC = a standard STMAS run using an older version of WRF
Initial fields of Composite Reflectivity from 12z runs (compared to the LAPS analysis and NOWRAD)LAPS and STMAS are pretty much identical and at the initial time have far more detail then the initial HRRR composite reflectivity. HRRR LAPS_CI STMAS_CI STMAS_CI_CYC NOWRAD LAPS Analysis
Initial fields of Surface Reflectivity from 12z runs (compared to the LAPS analysis and NOWRAD)LAPS and STMAS are pretty much identical at the surface as well. Interesting structure in the HRRR; not sure what it means! HRRR LAPS_CI STMAS_CI_CYC STMAS_CI LAPS Analysis NOWRAD
Initial fields of 700 mb Wind Divergence from 12z runs (compared to the LAPS analyses)There is a lot of “convective-scale” detail in both STMAS initial fields. Is this to be expected? LAPS_CI HRRR STMAS_CI_CYC STMAS_CI LAPS Analysis - Divergence LAPS Analysis – Balanced Divergence
Initial fields of 700 mb Wind Omega from 12z runs (compared to the LAPS analyses)Nothing really at time 0-h. LAPS_CI HRRR STMAS_CI_CYC STMAS_CI LAPS Analysis - Omega LAPS Analysis – Balanced Wind Omega
15-min forecast of Composite Reflectivity from 12z runs valid 1215z (compared to the LAPS analysis and NOWRAD)Not sure this qualifies as a “reflectivity burst”, but certainly there is an increase over the initial time in the LAPS and STMAS forecasts. HRRR LAPS_CI STMAS_CI_CYC STMAS_CI LAPS Analysis NOWRAD
15-min forecast of Surface Reflectivity from 12z runs valid 1215z (compared to the LAPS analysis and NOWRAD)At the surface the LAPS and STMAS forecasts are both quite close and appear to verify pretty well. There is not much difference between LAPS and the STMAS forecasts. HRRR LAPS_CI STMAS_CI_CYC STMAS_CI LAPS Analysis NOWRAD
15-min forecast of 700 mb Wind Divergence from 12z runs (compared to the LAPS analyses) valid 1215z There remains a lot of “convective-scale” detail in both STMAS initial fields. LAPS_CI HRRR STMAS_CI_CYC STMAS_CI LAPS Analysis - Divergence LAPS Analysis – Balanced Divergence
15-min forecast of 700 mb Wind Omega from 12z runs (compared to the LAPS analyses) valid 1215z More detail in both STMAS initial fields. LAPS_CI HRRR STMAS_CI_CYC STMAS_CI LAPS Analysis - Omega LAPS Analysis – Balanced Wind Omega
60-min forecast of Composite Reflectivity from 12z runs valid 1300z (compared to the LAPS analysis and NOWRAD)The white arrows point to the 2 areas of the strongest observed composite reflectivity; central PA, extreme southern NJ, south of Cape Cod, and most of WV. All the models forecast the strongest reflectivity somewhat displaced from where it is observed at least for some of the 4 areas of stronger reflectivity. The HRRR has developed stronger reflectivity on the eastern side of its reflectivity forecast, and not so much back in WV and PA. The 2 STMAS forecasts may come closest to the PA and WV areas, and are pretty close to each other. The character of the LAPS forecast is quite different from STMAS, which has more detail. HRRR LAPS_CI STMAS_CI_CYC STMAS_CI LAPS Analysis NOWRAD
60-min forecast of Surface Reflectivity from 12z runs valid 1300z (compared to the LAPS analysis and NOWRAD)There are some interesting differences in the forecasts. The strongest surface reflectivity in the LAPS analysis and NOWRAD extends from central PA to south-central NY, and all the forecasts miss this area, especially the HRRR. But the HRRR has not trouble forming a strong line of cells from about DC to south of Cape Cod, which turns out to be an over-prediction of the echo intensity in these areas. HRRR LAPS_CI STMAS_CI_CYC STMAS_CI LAPS Analysis NOWRAD
60-min forecast of 700 mb Wind Divergence from 12z runs (compared to the LAPS analyses) valid 1300z There are some differences between STMAS_CI and STMAS_CI_CYC. LAPS_CI HRRR STMAS_CI_CYC STMAS_CI LAPS Analysis - Divergence LAPS Analysis – Balanced Divergence
60-min forecast of 700 mb Wind Omega from 12z runs (compared to the LAPS analyses) valid 1300z Different detail in the more banded HRRR (off the coast). LAPS_CI missing HRRR STMAS_CI_CYC STMAS_CI LAPS Analysis - Omega LAPS Analysis – Balanced Wind Omega
Comparison of 1-h accumulated precipitation forecasts from the 12z runs for period ending 13zI was unsure of the amount of precipitation falling from NJ to south of Cape Cod, but the QPE analysis shows areas of 0.2-0.4”, and the HRRR captures this zone of precip best. There is a broader area of precipitation from LAPS_CI into NY that is not seen in the other runs, and is spotty in this area in the verification. Another area of locally heavier observed precip is in south-central PA with 0.2-0.4” observed. The STMAS runs have the most forecast for this area (although still only0.05-0.10”). It seems the bottom line from this comparison is that the HRRR is quickly able to produce heavier rains from a narrow band of convection just off the coast, while the other runs do not handle this well. This area of precipitation was in more of a warmer air mass than the other precip farther inland. LAPS_CI HRRR STMAS_CI STMAS_CI_CYC NOWRAD Analysis at 13z QPEAnalysis
3-h forecast of Composite Reflectivity from 12z runs valid 1500z (compared to the LAPS analysis and NOWRAD)The white arrows point to some of the areas of higher reflectivity in the LAPS analysis. The yellow arrows show the leading edge of what looks like a line feature that forms in the STMAS runs. Do not see though any evidence of this feature in the analyses. LAPS_CI is the only forecast to shift the higher reflectivities into eastern New England. HRRR LAPS_CI STMAS_CI_CYC STMAS_CI LAPS Analysis NOWRAD
3-h forecast of Surface Reflectivity from 12z runs valid 1500z (compared to the LAPS analysis and NOWRAD)Qualitatively it would be hard to say that the HRRR forecast is not at least a little better than the others at this point. HRRR LAPS_CI STMAS_CI_CYC STMAS_CI LAPS Analysis NOWRAD
Comparison of 3-h accumulated precipitation forecasts from the 12z runs for period ending 15zNote that the scale is different for the forecasts in order to get the 3-h total precipitation. Some things to note include:1) LAPS has the most precip into New England.2) HRRR still has the most precip, with a max of 1-2” from NJ to south of Cape Cod. Observed in this area is in the 0.2-0.4” range with a few maxima of 0.4-0.6”. While the LAPS and STMAS runs have much less in this area they really miss this max.3) All the runs have a pretty good northern edge to the precip area.4) The STMAS and LAPS forecasts for se PA area are somewhat more than observed. LAPS_CI HRRR STMAS_CI STMAS_CI_CYC NOWRAD Analysis at 15z QPEAnalysis
Comparison of 6-h accumulated precipitation forecasts from the 12z runs for period ending 18zThe scale is the same as in the previous slide. Things to note include:1) Now we see some bigger differences between STMAS_CI and STMAS_CI_CYC. 2) LAPS still has the most precip into New England, and this looks good.3) The max forecast values are in the 1-2” range in each model forecast, with the greatest area in this range in the HRRR and STMAS_CI_CYC forecasts. The observations show max values generally in the 0.4-0.6” range, except a small area up to 1” in WV. So the more area of predictions in the higher range the greater the over-prediction. LAPS_CI HRRR STMAS_CI STMAS_CI_CYC NOWRAD Analysis at 18z QPEAnalysis
20 dBZ Bias 20 dBZ ETS 30 dBZ Bias 30 dBZ ETS 40 dBZ Bias 40 dBZ ETS