Download
1 / 1
20 likes | 157 Vues
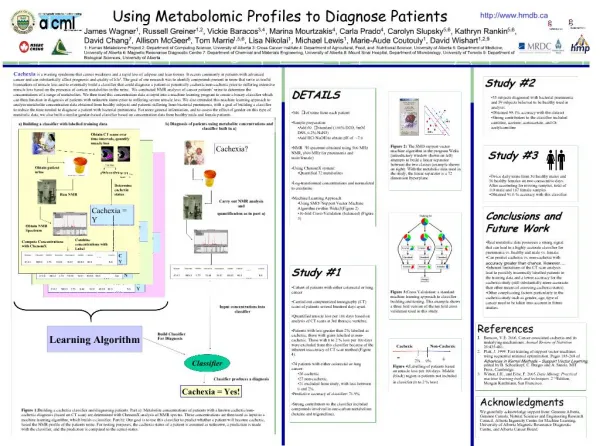
This study explores the use of urinary metabolites to create effective classifiers for diagnosing cachexia and bacterial pneumonia. Cachexia, a serious wasting syndrome often found in cancer patients, can severely impact prognosis and quality of life. Through NMR analysis, we identified key metabolites associated with muscle loss. We developed machine learning algorithms that achieved high accuracy in diagnosing patients based on metabolite concentrations. The findings indicate strong potential for metabolite-based diagnostics in clinical settings, providing a non-invasive approach to identifying at-risk patients.

E N D
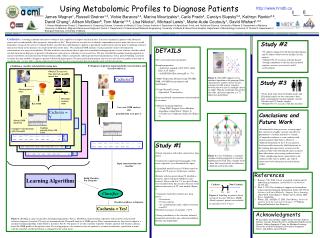
159 days CT -1 CT -2 Time Death Hypoxanthine Imidazole Indole-3-acetate Isoleucine Isopropanol Lactate Lactose … Leucine Glucose Hippurate Histidine Isoleucine Isopropanol Lactate Lactose … Leucine 4.14 5993.2 2.73 10.44 16.01 40.83 90.3 … 5.6 414.2 599.3 2.73 10.44 16.01 40.83 90.3 … 5.6 Glucose Hippurate Histidine Isoleucine Isopropanol Lactate Lactose … Leucine C N 414.2 599.3 2.73 10.44 16.01 40.83 90.3 … 5.6 Glucose Hippurate Histidine Isoleucine Isopropanol Lactate Lactose … Leucine 314.2 599.3 2.73 8.44 16.01 40.83 90.3 … 5.6 http://www.hmdb.ca James Wagner1, Russell Greiner1,2, Vickie Baracos3,4, Marina Mourtzakis4, Carla Prado4, Carolyn Slupsky5,6, Kathryn Rankin5,6, David Chang7, Allison McGeer8, Tom Marrie1,5,6, Lisa Nikolai1, Michael Lewis1, Marie-Aude Coutouly1, David Wishart1,2,9 1: Human Metabolome Project 2: Department of Computing Science, University of Alberta 3: Cross Cancer Institute 4: Department of Agricultural, Food, and Nutritional Science, University of Alberta 5: Department of Medicine, University of Alberta 6: Magnetic Resonance Diagnostic Centre 7: Department of Chemical and Materials Engineering, University of Alberta 8: Mount Sinai Hospital, Department of Microbiology, University of Toronto 9: Department of Biological Sciences, University of Alberta Using Metabolomic Profiles to Diagnose Patients Cachexia is a wasting syndrome that causes weakness and a rapid loss of adipose and lean tissues. It occurs commonly in patients with advanced cancer and can substantially affect prognosis and quality of life1. The goal of our research was to identify compounds present in urine that serve as useful biomarkers of muscle loss and to eventually build a classifier that could diagnose a patient as potentially cachexic/non-cachexic prior to suffering extensive muscle loss based on the presence of certain metabolites in the urine. We conducted NMR analysis of cancer patients’ urine to determine the concentrations of a range of metabolites. We then used this concentration data as input into a machine learning program to create a binary classifier which can then function in diagnosis of patients with unknown status prior to suffering severe muscle loss. We also extended this machine learning approach to analyze metabolite concentration data obtained from healthy subjects and patients suffering from bacterial pneumonia, with a goal of building a classifier to reduce the time needed to diagnose a patient with bacterial pneumonia. For more general information, and to assess the effect of gender on this type of metabolic data, we also built a similar gender-based classifier based on concentration data from healthy male and female patients. Study #2 • 55 subjects diagnosed with bacterial pneumonia and 59 subjects believed to be healthy used in analysis. • Obtained 98.1% accuracy with this dataset • Strong contributors to the classifier included carnitine, acetone, acetoacetate, and O-acetylcarnitine DETAILS • 540 l of urine from each patient • Sample preparation • Add 60 l standard (100% D2O, 5mM DSS, 0.2% NaN3) • Add HCl/NaOH to obtain pH of ~7.0 • NMR 1H spectrum obtained using 500 MHz NMR, (600 MHz for pneumonia and male/female) • Using ChenomX system: • Quantified 72 metabolites • Log-transformed concentrations and normalized to creatinine • Machine Learning Approach • Using SMO2 Support Vector Machine Algorithm (within Weka)3 (Figure 2) • 10-fold Cross-Validation (balanced) (Figure 3) b) Diagnosis of patients using metabolite concentrations and classifier built in a) a) Building a classifier with labelled training data Cachexia = N Obtain CT scans over time intervals, quantify muscle loss Cachexia? Figure 2: The SMO support vector machine algorithm in the program Weka (introductory window shown on left) attempts to build a linear separator between the two classes (example shown on right). With the metabolic data used in the study, the linear separator is a 72 dimension hyperplane. Study #3 Obtain patient urine • Twice daily urine from 30 healthy males and 30 healthy females on two consecutive days. After accounting for missing samples, total of 118 male and 107 female samples • Obtained 91.6 % accuracy with this classifier Determine cachexia status Run NMR Carry out NMR analysis and quantification as in part a) Cachexia = Y Conclusions and Future Work • Real metabolic data possesses a strong signal that can lead to a highly accurate classifier for pneumonia vs. healthy and male vs. female. • Can predict cachexia vs. non-cachexia with accuracy greater than chance. However…. • Inherent limitations of the CT scan analysis lead to possibly incorrectly labelled patients in the training data and a lower accuracy for the cachexia study (still substantially more accuracte than other means of assessing cachexia status). • Other complicating factors particularly in the cachexia study such as gender, age, type of cancer need to be taken into account in future studies. Cachexia = N ObtainNMR Spectrum Cachexia = Y Combine concentrations with Label Compute Concentrations with ChenomX C N C Y Study #1 • Cohort of patients with either colorectal or lung cancer • Carried out computerized tomography (CT) scans of patients several hundred days apart. • Quantified muscle loss per 100 days based on analysis of CT scans at 3rd thoracic vertebra. • Patients with loss greater than 2% labelled as cachexic, those with gains labelled as non-cachexic. Those with 0 to 2 % loss per 100 days were excluded from this classifier because of the inherent inaccuracy of CT scan method (Figure 4). • 74 patients with either colorectal or lung cancer: • 26 cachexic • 27 non-cachexic. • 21 excluded from study, with loss between 0 and 2%. • Predictive accuracy of classifier: 71.9% • Strong contributors to the classifier included compounds involved in one-carbon metabolism (betaine and trigonelline). Hypoxanthine Imidazole Indole-3-acetate Isoleucine Isopropanol Lactate Lactose … Leucine 312.5 993.2 2.73 10.44 16.01 40.83 90.3 … 5.6 C Y Figure 3: Cross Validation: a standard machine learning approach to classifier building and testing. This example shows a three fold version of the ten fold cross validation used in this study. Input concentrations into classifier References Baracos, V.E. 2006. Cancer associated cachexia and its underlying mechanisms. Annual Review of Nutrition 26:435-461. 2. Platt, J. 1999. Fast training of support vector machines using sequential minimal optimization. Pages 185-208 of Advances in Kernel Methods – Support Vector Learning, edited by B. Schoelkopf, C. Burges and A. Smola. MIT Press, Cambridge. 3. Witten, I.H., and Eibe, F. 2005. Data Mining: Practical machine learning tools and techniques. 2nd Edition, Morgan Kaufmann, San Francisco. Learning Algorithm Build Classifier For Diagnosis Cachexic Non-Cachexic - Classifier + 2% 0% Figure 4: Labelling of patients based on muscle loss per 100 days. Middle (black) region is patients not included in classifier (0 to 2 % loss) Classifier produces a diagnosis Cachexia = Yes! Acknowledgments Figure 1: Building a cachexia classifier and diagnosing patients. Part a): Metabolite concentrations of patients with a known cachexic/non-cachexic diagnosis (based on CT scan) are determined with ChenomX analysis of NMR spectra. These concentrations are then used as input to a machine learning algorithm, which builds a classifier. Part b): Our goal is to use this classifier to predict whether a patient will become cachexic, based the NMR profile of the patients urine. For testing purposes, the cachexia status of a patient is assumed as unknown, a prediction is made with the classifier, and the prediction is compared to the actual status. We gratefully acknowledge support from: Genome Alberta, Genome Canada, Natural Sciences and Engineering Research Council, Alberta Ingenuity Centre for Machine Learning, University of Alberta Magnetic Resonance Diagnostic Centre, and Alberta Cancer Board.