
Examining Masked Picture Repetition Effects with EEG and MEG
Study investigates object recognition through high-density ERP and MEG recordings. Comparison reveals insights on time course and neural activity patterns.

Examining Masked Picture Repetition Effects with EEG and MEG
E N D
Presentation Transcript
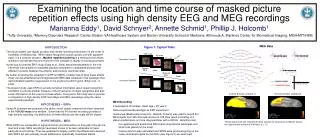
50 fT/cm 200 400 600 800 Examining the location and time course of masked picture repetition effects using high density EEG and MEG recordingsMarianna Eddy1, David Schnyer2, Annette Schmid1, Phillip J. Holcomb1 1Tufts University, 2Memory Disorders Research Center, Boston VA Healthcare System and Boston University School of Medicine; Athinoula A. Martinos Center for Biomedical Imaging, MGH/MIT/HMS INTRODUCTION Thevisual system can rapidly process and identify incoming information on the order of hundreds of milliseconds. While object-recognition occurs quickly and with apparent ease, it is a complex process. Masked repetition priming is a technique that allows isolation of processes that are involved in this cascade of rapidly occurring processes. A previous 32 channel ERP study (Eddy et al., 2004) demonstrated effects in the 100-300 msec time window for repeated pictures compared to unrepeated pictures that differed in polarity between the anterior and posterior electrode sites. By further extending this paradigm to ERP and MEG, a better idea of what these effects mean can be established and integrated with fMRI data collected in this paradigm that demonstrated repetition suppression in the posterior fusiform gyrus (Eddy et al., in prep). The present study uses ERPs to provide temporal information about object recognition and MEG to provide another measure of the timecourse of object recognition and also some information on the source of these effects. One goal of this study was to provide a comparison of high density ERP recordings and MEG recordings using the same experimental paradigm. HYPOTHESES – ERPs Using 64 channels we expected to be able to more closely examine the effect observed in the 100-300 msec time window. Given that the 64 channel recording provides a high density recording, the distribution of these effects over the scalp will be clearer. HYPOTHESES – MEG While ERPs are susceptible to signal distortion and attenuation as they pass through the skull and scalp, MEG recordings have been shown to be less vulnerable to these particular shortcomings. Thus we predicted to largely confirm the differences observed with ERPs but also possibly reveal additional or specifically modulated effects. MEG Data Figure 1: Typical Trials 293 msec 53 msec 13 msec 53 msec Repetition Condition 293 msec Forward Mask Prime Backward Mask Target Unrelated Condition Inverse Solution (subject 1) Inverse Solution (subject 2) • MEG Recording • 2 participants (2 females, mean age = 20 years) • Same experimental paradigm as ERP experiment • Vectorview (Elekta-Neuromag Ltd., Helsinki, Finland) was used to record the MEG signal from 306 channels located at 102 sites (each consisting of 2 planar gradiometers and one magnetometer with a 600 Hz sampling rate). • Co-registered with anatomical MRI scans using fiducial landmarks and small coils placed on the scalp. • Inverse solution was calculated and SPMs were produced giving us the noise normalized signal for the ROIs (see Figure 2) we examined. These maps show the resulting inverse solution for all picture conditions across the right ventral surface of the brain, p < .01
Mean Noise Normalized Signal between 100-300 ms (subject 1) Mean Noise Normalized Signal between 100-300 ms (subject 2) • WHY COMPARE ERPs AND MEG? • Unlike ERPs, MEG is undistorted by the scalp and skull and can give better signal from deeper sources. • MEG can provide good temporal resolution as does ERPs, however, MEG can provide better spatial accuracy than ERPs. • ERPs are sensitive to both radial and tangential sources while MEG is only sensitive to tangential, therefore combined together, they provide complimentary information. • Both are direct measures of the synchronous neuronal activity and overall, they should show similar effects, however, each can provide slightly different information that can contribute to the interpretation of the other. • METHODS • Masked Picture Priming – Semantic Categorization Task • 64 Channel Event-Related Potentials (ERPs) • 13 participants (5 females, mean age = 20 years) • Participants were instructed to respond when they detected food items. • 60 trials of each condition (see Figure 1) • 60 trials of probe pairing • (30 with food item in prime position 30 with food item in target position) • Primes were forward and backward masked with a pixelated image • ERPs were recorded from 64 channels Figure 2: ROIs – Fusiform Gyrus RH LH RESULTS DISCUSSION Both the MEG and ERP data show a similar pattern of effects – even in only two MEG subjects. While our fMRI data from a previous study suggested the fusiform was a likely candidate for the generator of this early ERP component we were observing, the MEG data confirmed this by the inverse solution projected onto the subjects’ surface. FUTURE DIRECTIONS Replicate this effect in more MEG subjects and apply source localization to ERP data as well. Examine in the future other areas/effects (e.g., N300/N400) that MEG may be more sensitive to in the case of masked priming than ERPs – or it may be the case that these effects are not observed with rapid prime presentation. ERP Data RH LH Contact information: marianna.eddy@tufts.edu This research was supported by HD25889, HD043251and K23MH64004


