Download
1 / 30
300 likes | 477 Vues
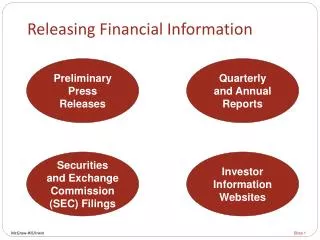
Releasing Financial Information. Preliminary Press Releases. Quarterly and Annual Reports. Securities and Exchange Commission (SEC) Filings. Investor Information Websites. Horizontal (Trend) Analysis. Horizontal analysis compares a company’s financial condition and performance over time.

E N D
Releasing Financial Information Preliminary Press Releases Quarterlyand Annual Reports Securitiesand Exchange Commission (SEC) Filings Investor Information Websites
Horizontal (Trend) Analysis Horizontal analysis compares a company’s financial conditionand performance over time. A year-over-year percentage change expresses the current year’s dollar change as a percentageof the prior year’s total using this formula. Percent Change Current Year’s Total ̶ Prior Year’s Total Prior Year’s Total × 100% =
Changes Revealed in Trend Analysis Lowe’s grew significantly in 2006. Total assets rose by 12.7 percent Net sales revenues rose by 8.5 percent. Gross profit rose by 9.5 percent Net income rose by 12.3 percent. The growth in net sales revenues more than offset the growth in expenses resulting in net income growth in 2006 that was greater than the net sales revenues growth.
Vertical (Common Size) Analysis Vertical analysis focuses on important relationships within financial statements by expressing each financial statement amount as a percentage of another amount on that statement. Common-size percentages for financialstatements are calculated using this formula. Common-size Percent Analysis Amount Base Amount × = 100% The base amount is total assets for the balance sheetand sales revenue for the income statement.
Interpreting Common Size Statements Lowe’s total assets grew in 2006 by more than $3,000,000,000. Most of the growth was in property and equipment which increased from 66.4 percent of total assets in 2005 to 68.3 of total assets in 2006. The growth in total assets was accompanied by increases in all major categories of liabilities and equities. However, only long-term liabilities increased as a percent of total assets, from 18.3 percent of total assets in 2005 to 19.8 percent of total assets in 2006.
Interpreting Common Size Statements Lowe’s was able to increase its net income as a percent of sales from 6.4 percent to 6.6 percent by reducing cost of goods sold as a percent of sales by 0.3 percent. The percentage decrease in cost of goods sold was partially offset by small increase in operating and other expenses.
Financial Ratios Financial ratio analysis compares amounts for one or more financial statement items to amounts for other financial statement items in the same year. Ratio Analysis
Profitability Ratios Profitability ratios provide us with measuresof a company’s ability to generateincome in the current period. Net profit margin Gross profit percentage Fixed asset turnover Asset turnover Earnings per share (EPS) Return on equity (ROE) Return on assets (ROA) Price/earnings(P/E)
Profitability Ratios ̶ Net Profit Margin Net incomeNet sales revenue Net profit margin × 100% = Lowe’s 2006: ($3,105 ÷ $46,927) × 100% = 6.6% Lowe’s 2005: ($2,765 ÷ $43,243) × 100% = 6.4% Net profit margin represents the percentage of sales revenue that remains in net income after expenseshave been deducted.
Profitability Ratios ̶ Gross Profit Percentage Net sales ‒ Cost of goods soldNet sales Gross profit percentage × 100% = Lowe’s 2006: (($46,927 ‒ $30,729) ÷ $46,927) × 100% = 34.5% Lowe’s 2005: (($43,243 ‒ $28,453) ÷ $43,243) × 100% = 34.2% Gross profit percentage indicates how much profit was made, on average, on each dollar of sales, after deduction of cost of goods sold.
Profitability Ratios ̶ Asset Turnover Net sales revenueAverage total assets Asset turnover = Lowe’s 2006: $46,927 ÷ (($27,767 + $24,639) ÷ 2) = 1.79 Lowe’s 2005: (Given) = 1.89 The asset turnover ratio indicates the amount of sales revenue generated for each dollar invested in assets.
Profitability Ratios ̶ Fixed Asset Turnover Net sales revenueAverage net fixed assets Fixed asset turnover = Lowe’s 2006: $46,927 ÷ (($18,971 + $16,354) ÷ 2) = 2.66 Lowe’s 2005: (Given) = 2.86 The fixed asset turnover ratio indicates the amount of sales revenue generated for each dollar invested in fixed assets such as store buildings and land used in the business.
Profitability Ratios ̶ Return on Assets (ROA) Net incomeAverage total assets × 100% ROA = Lowe’s 2006: $3,105 ÷ ($27,767 + $24,639) ÷ 2) × 100% = 11.8% Lowe’s 2005: (Given) = 12.1% The return on assets ratio measures how much a company earns for each dollar of investment in assets.
Profitability Ratios ̶ Return on Equity (ROE) Net income Average stockholders’ equity × 100% ROE = Lowe’s 2006: $3,105 ÷ (($15,725 + $14,296) ÷ 2) × 100% = 20.7% Lowe’s 2005: (Given) = 21.4% The return on equity ratio measures the amount earned as a percentage of each dollar invested by stockholders.
Profitability Ratios ̶ Earnings per Share (EPS) Net income Average number of common shares EPS = EPS is reported in the income statement. Lowe’s 2006: EPS = $2.02 Lowe’s 2005: EPS = $1.78 Earnings per share indicates the amount of earningsfor each share of outstanding common stock.
Profitability Ratios ̶ Price/Earnings (P/E) Ratio Stock priceEPS P/E Ratio = The stock price was $31 per share at thetime 2006 earnings were announced. Lowe’s 2006: $31 ÷ $2.02 = 15.3 Lowe’s 2005: (Given) = 16.3 The P/E ratio measures the relationship between the current market price of the stock and its earnings per share.
Liquidity Ratios Liquidity ratios focus on a company’s abilityto convert its assets into cash in order topay current liabilities as they come due. Inventory turnover Receivables turnover Current ratio Quick ratio
Liquidity Ratios ̶ Receivables Turnover Net sales revenueAverage net receivables Receivables turnover = Lowe’s receivables balance from customers is insignificant because most sales are cashor credit card sales. The receivables turnover ratio is a measure of how fast a company collects its receivables.
Liquidity Ratios ̶ Inventory Turnover Cost of salesAverage inventory Inventory turnover = Lowe’s 2006: $30,729 ÷ (($7,144 + $6,635) ÷ 2) = 4.5 Lowe’s 2005: (Given) = 4.5 The inventory turnover ratio indicates how many times inventory is bought and sold during the period.
Liquidity Ratios ̶ Days to Sell 365Inventory turnover ratio Days to sell = Lowe’s 2006: 365 ÷ 4.5 = 81.1 days Lowe’s 2005: 365 ÷ 4.5 = 81.1 days The days to sell ratio converts inventory turnoverinto the number of days need to sell inventory.
Current ratio Current assets Current liabilities = Liquidity Ratios ̶ Current Ratio Lowe’s 2006: $8,314 ÷ $6,539 = 1.27 Lowe’s 2005: $7,788 ÷ $5,832 = 1.34 The current ratio measures the ability of a company to pay its current debts as they become due.
Quick ratio Quick assets Current liabilities = Liquidity Ratios ̶ Quick Ratio Lowe’s 2006: $796 ÷ $6,539 = 0.12 Lowe’s 2005: $876 ÷ $5,832 = 0.15 The quick ratio is similar to the current ratio,but measures the company’s immediateability to pay it current debts.
Solvency Ratios Solvency ratios focus on a company’s ability torepay debt, pay interest, and finance replacementand/or expansion of long-term assets. Times interest earned Debt-to- assets Free cashflow
Solvency Ratios ̶ Debt-to-assets Ratio Total liabilitiesTotal assets Debt-to assets = Lowe’s 2006: $12,042 ÷ $27,767 = 0.43 Lowe’s 2005: $10,343 ÷ $24,639 = 0.42 The debt-to-assets ratio indicates the proportionof total assets that is financed by creditors.
Times interest earned Net Interest Income tax income expense expense Interest expense + + = Solvency Ratios ̶ Times Interest Earned Ratio Lowe’s 2006: ($3,105 + $154 + $1,893) ÷ $154 = 33.5 Lowe’s 2005: ($2,765 + $158 + $1,731) ÷ $158 = 29.5 The times interest earned ratio indicates the number of times a company’s interest expensewas covered by its operating results.