Download
1 / 30
300 likes | 528 Vues
Chapter 6 Risk and Value in the Hospitality Firm. Objectives. Incorporating Risk into the Valuation of a Hospitality Asset Measuring the Characteristics of Return and Cash Flow Distributions Attitudes Toward Risk and Return

E N D
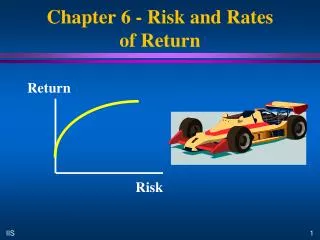
Chapter 6 Risk and Value in the Hospitality Firm
Objectives • Incorporating Risk into the Valuation of a Hospitality Asset • Measuring the Characteristics of Return and Cash Flow Distributions • Attitudes Toward Risk and Return • Choosing Among Projects on the Basis of Expected Return and Total Risk • Reducing Risk Through Diversification • Adding Investments to Diversified Portfolios • Estimating the Components of the Security Market Line
kE = R f + Risk Premium • Price of time = Rf • Price of Risk = Risk Premium • kE = R f +(Operating Risk Premium + Financial Risk Premium) Operating Risk – variability of operating cash flows Financial Risk – increased variability of cash flows to equity due to the use of debt financing
Risk and the Valuation of Hospitality Assets Riskless Restaurant: Probability DIV1 kE 1.0 $55 10% Determining V0: V1 = Vo (1 + k)or V0 = V1 /(1 + k) For our example: V0[DIV1] = DIV1/(1+k) = $55/(1+.10) = $50
Risky Restaurant Event (state of the economy) Probability DIV1 1 .3 $53 2 .3 $54 3 .4 $55 An equally risky, alternative investment: Event Probability kE 1 .3 .325 2 .3 .350 3 .4 .375
Value of a share of the Risky Restaurant: Event Probability V1 /(1 + k) = v0 1 .3 $53 /(1 + .325) = $40 2 .3 $54 /(1 + .350) = $40 3 .4 $55 /(1 + .375) = $40 Or doing these calculations in Excel:
Attitudes Toward Risk and Return • Most people, including the owners of hospitality firms, lose more utility (happiness or satisfaction) for a given dollar loss than they gain in utility for the same dollar gain • Declining marginal utility for money – the more money we have, the less happiness or utility we get from each additional dollar we gain • Declining marginal utility for money is the basis of the attitude individuals are usually assumed to have toward risk – risk aversion • Risk aversion simply means that in order to get a person to bear more risk, everything else being the same, he or she must be offered a greater expected return
Choosing Among Projects on the Basis of Expected Return and Total Risk (σ) • Borrowing/Lending Lines - all of the risk/return combinations that can be achieved by borrowing or lending (at Rf) and investing in a risky asset • Choose the risky asset with the highest borrowing/lending line
Comparison of the Three Remaining Projects by Risk and Return
Reducing Risk Through Diversification • Burger Master vs. Haute Eatery – correlation coefficient = -1.0 Can eliminate all risk • Burger Master vs. Burger Towne – correlation coefficient = +1.0 Can eliminate no risk • Burger Master vs. Steak House – correlation coefficient less than +1.0 but greater than -1.0 Can eliminate some risk
Multi-Asset Portfolios • Billowing Sail diagram – billows to the left due to correlations between 0.0 and +1.0 • Efficient portfolios - portfolios along the upper boundary of the billowing sail • Market Portfolio – found with a borrowing/lending line to the most efficient portfolio • Capital Market Line – borrowing/lending line through the market portfolio’s risk and return combination
The Risk and Return Combinations for Restaurants ABC and XYZ
Adding Investments to Diversified Portfolios • When a hospitality manager undertakes a project (that is, invests the owner’s money), that project is essentially being added to the owner’s diversified portfolio Implications: • Since the owners can easily diversify their own portfolios, they usually prefer that the individual firms in their portfolio do not diversify themselves at the firm level but rather focus on a clearly defined and focused product and service mix. • The only risk that will matter to the firm’s owners—will be the project’s non–diversifiable risk, that is the project’s risk that is not eliminated in the owner’s portfolio
SML and Value • Any project or investment whose ROE/β combination lies above the SML will be value creating (and have an NPV > 0). • Any project or investment whose ROE/ β combination lies below the SML will be value destroying (and have a NPV < 0). • A project that lies on the SML will neither be value creating nor value destroying. It will have an ROE equal to kE (NPV = 0) and the owners would be indifferent toward it.
The Relationship Describing the SML y = a + bx where y = dependent variable a = intercept b= slope x = independent variable On the SML, y = kE , a = R f (risk–free rate), and x = β. The slope will be: km- R f = km- R f = km- R f βm 1.0
As an example, suppose we are considering expanding a hotel by adding a new wing and we have estimated the following information: R f= 8% km = 16% βnew wing = 1.2 We could then estimate our owners’ required rate of return, kE, associated with the investment of their money in the new wing project: kE new wing = R f + [km-R f ]βnew wing = .08 + [.16 - .08]1.2 = 17.6%
Estimating the SML • Rf is usually taken to be the current rate of return on U.S. Treasury securities of comparable maturity to the project. These rates (the “yields to maturity”) are published daily in financial newspapers. • One fairly simple way to estimate the expected return on the market portfolio, km, is to add approximately 8% to the current U.S. Treasury bond rate. • One way to estimate beta is to compare how the project’s return has varied in comparison with the market’s return in the past and to use this to estimate future volatility.
Summary • The estimation of relevant risk is a critical part of the hospitality manager’s decision–making process. • When the managers of a hospitality firm estimate the relevant risk of a project, the risk must be the project’s non–diversifiable risk (the risk of the project that will not be eliminated in the owner’s diversified portfolio). • One measure of this non–diversifiable risk is beta, which tells us how risky the project is relative to the risk of the market portfolio. • Having estimated the beta of a project, we can use the security market line to determine the kEfor the project. • In order for a project to be worthwhile, it will have to generate an expected rate of return for the owners (ROE) greater than kE.