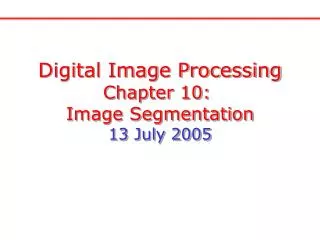
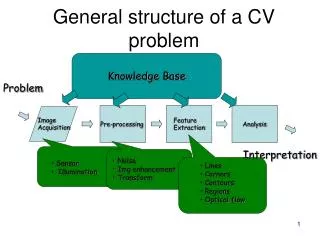
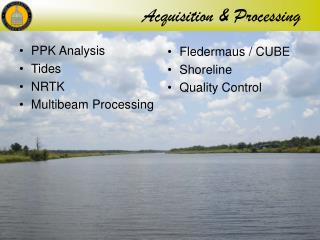
Acquisition & Processing
Acquisition & Processing. Fledermaus / CUBE Shoreline Quality Control. PPK Analysis Tides NRTK Multibeam Processing. PPK Analysis. PPK Analysis. RMS of GPS heights. PPK Analysis. Local Storm Events. DOP. PPK Analysis. H-RMS vs PDOP. No storm event, but still a ‘jump’?.

Acquisition & Processing
E N D
Presentation Transcript
Acquisition & Processing • Fledermaus / CUBE • Shoreline • Quality Control • PPK Analysis • Tides • NRTK • Multibeam Processing
PPK Analysis • RMS of GPS heights
PPK Analysis • Local Storm Events
DOP PPK Analysis • H-RMS vs PDOP No storm event, but still a ‘jump’? NDBC did not experience a similar ‘jump’… perhaps an equipment problem?
PPK Analysis • Ashtech comparison • Simultaneous static observation Static field test suggestive of an equipment failure…
PPK Analysis STORM FRONT ADVANCING
PPK Analysis RAIN ALL DAY
PPK Analysis STORM
PPK Analysis Conclusions… • Poor weather is a precursor to poor PPK (at rover or base) • Good weather is not a sufficient condition for good PPK • Difficult to correlate predicted PDOP spikes with poor PPK • The equipment may be faulty…PE worthy?
Tides North Quay Wall South Quay Wall
Tides • Vertical Datum established through static GPS observations at Bench Marks • Sounding Datum then determined by using recovered relationship (From class of 05) between NAVD 88 and local SD • Further analysis conducted using T-Tide to determine constituents
Leveling 0.699
Sounding Datum • Sounding Datum transfer (Diurnal tides) • Previous Transfer conducted by class of 05
Sounding Datum • As a check to this, a Diurnal SD transfer was conducted using constituents Height of CD above zero of new gauge Height of MSL above zero of new gauge Sum of M2,S2,K1 & O1 at new gauge d = z’ – (Z’ x h/H) Height of MSL above CD of established gauge Sum of M2,S2,K1 & O1 at established gauge
Comparison 2005 Transfer: 0.699m 2008 Transfer: 0.849m Why? * Difference in constituents analysed using t_tide * Length of observations on new gauge * Same method used in 05?
Tidal Analysis K1: Diurnal Moon O1: Diurnal Moon
Tidal Analysis Short Frequency Constituents
NRTK • The Gulf Coast Geospatial Center loaned us a Trimble R7 with TSC2 controller • This piece of equipment was deemed useless for our purposes because: • It doesn’t work at typical survey speeds • It doesn’t time stamp the data it collects • It has no cell phone connectivity in our survey area Frisbee anyone?
2 m Static Tide Obs
The Big Picture Bathymetry Data Tide Data PPK GPS Sound Velocity True Heave CARIS HIPS IVS Fledermaus Filtered Soundings CUBE Surface
Multibeam Processing Software CARIS HIPS 1 Convert XTF to HDCS Apply correctors and filters CUBE surface IVS Fledermaus Create PFM Flag data using CUBE hypothesis Filter data to CUBE surface • FLEDERMAUS PARAMETERS: • Filter: 1.5 σ of CUBE surface • Noisy data • Confident in CUBE surface CARIS HIPS 2 Quality Control & final cleaning Recompute CUBE surfaces Finalize CUBE surfaces QINSy Export QINSy (.db) to XTF • CUBE PARAMETERS: • IHO Order 1 (area of influence of sounding to node) • Disambiguation Method: Density and Locale (hypothesis with greatest number of soundings consistent to neighboring nodes) • Configuration: Default (Surface creation/disambiguation)
Key CUBE Assumptions • Assuming all gross errors have been removed: • The more soundings CUBE has, the more robust and certain the solution. • The larger the area processed, the more efficient the validation.
Processing Facts • 451,956 CUBE bins • With 1m Bins: 451,956 m2 • Checked Areas: 105,042 m2 – 23% Checked • 45,070 Edited CUBE bins – 10% Changed • 38,399,520 Total Soundings • 30,008,414 Accepted Soundings • 8,391,106 Rejected Soundings – 22% Rejected • CUBE Validation Time: 18hrs • Dot Killing at 10 dots a second – 233hrs
Shoreline • Preparation • Aerial Photographs • Mississippi Geospatial Clearinghouse • February 14, 2007 • Scale: 1 to 100 • 15 cm ground sample distance • Orthorectified to the Mississippi State Plane Coordinate System • Datum: NAD 83 and NAVD 88 • CARIS Notebook • COALNE • 1:3,000
Shoreline • Acquisition • Shoreline files converted from .hob to .000 • Loaded in to HYPACK and QINsy as background files • Shoreline visually verified during SBES, SSS, and MBES acquisition • Processing • S-57 Composer • MBES Soundings • Results • Priority Areas 1 & 2 • ~10 meters inshore the digital imagery
Shoreline ~10 m Original Coastline Updated Coastline
ATONs • GPS • Trimble (DGPS) • GARMIN GPSMAP 76 • CARIS Notebook • GPS Logging • Real time S-57 attributes • .hob file to S-57 Composer for ENC compilation
ENC New Detached Position
ENC GARMIN 76 Trimble ATONs
Quality Control • TPU • Crossline Check • Chart Comparison • Singlebeam vs. Multibeam • Prior Surveys
Quality Control - TPU Reasonable TPU values??? TPU (m) An increase in TPU was noted with increasing beam angle …
Quality Control - TPU TPU (m) …while a minimum in TPU was noted at the nadir angle.
Quality Control - TPU TPU (m) An odd ‘plateau’ was noted in the starboard-most beams’ TPU…
Quality Control - TPU Noisy outerbeams resulting from a truncated receive time… …where outer-fluff is at a constant range…
(m) Slant Range (m) Quality Control - TPU …Total Fluff meets IHO Order 1a specs?!? TPU …which prompted us to compare TPU to Slant Range
Quality Control – Crossline Check Two crossline comparisons were performed • Intraday – Comparing morning and afternoon datasets • Interday – Comparing datasets from Dn182 and Dn183
~100 Quality Control – Crossline Check Intraday… Beam #
? ~100 Quality Control – Crossline Check Interday… Beam #
~100 off center beam Quality Control – Crossline Check
~100 Quality Control – Crossline Check