Graph
1. -. y. –. 3. =. x. 2. 3. Warm Up. Graph. 2. Find the slope of the line that passes through ( 5, 2) and (-5, -3). 2.4 Part 2 Sept 6, 2013. Graphing Equations in Standard Form Step 1: Find the x-intercept by letting y = 0 and solving for x. Plot (x, 0)

Graph
E N D
Presentation Transcript
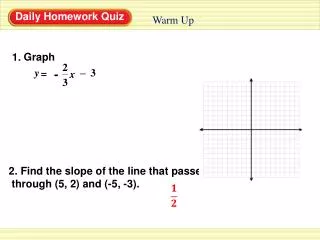
1. - y – 3 = x 2 3 Warm Up Graph 2. Find the slope of the line that passes through (5, 2) and (-5, -3).
Graphing Equations in Standard Form Step 1: Find the x-intercept by letting y = 0 and solving for x. Plot (x, 0) Step 2: Find the y-intercept by letting x = 0 and solving for y. Plot (0, y). Step 3: Draw a line through the two points .
Example 3 ( ( ) ) 3 2 0 0 Let x = 0 Graph 3x + 2y = 12 + 2y 12 = Let y = 0 3x + 12 = Draw Quick Graphs STEP 1 Find the x-intercept. 3x = 12 3 3 x = 4 The x-intercept is 4, so plot the point (4, 0). STEP 2 Find the y-intercept. 2y = 12 2 2 y = 6 The y-intercept is 6, so plot the point (0, 6). STEP 3 Draw a line through the intercepts.
Example 3 Graph 3x + 2y = 12 Short cut version
Checkpoint 1. x + y 2 = Draw Quick Graphs Graph the equation.
Checkpoint 5x + 2y 10 = 2. Draw Quick Graphs Graph the equation.
Graphing x = # Ex. Graph x = -3 The x coordinate is -3 no matter what the value of y is. • Choose any value of y • • • So, the graph of x = # is always a VERTICAL LINE
Ex. Graph x = 4 The graph of x = 4 is VERTICAL LINE at 4.
Graphing y = # Ex. Graph y = 2 The y coordinate is 2 no matter what the value of x is. Choose any value of x • • • • So, the graph of y = # is always a HORIZONTAL LINE
Ex. Graph y = -4 The graph of y = -4 is HORIZONTAL LINE at -4.
Homework: WS: Graphing Equations in Standard Form