Precipitation
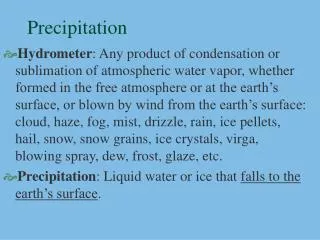
Precipitation. Precipitation: water falling from the atmosphere to the earth. Rainfall Snowfall Hail, sleet Requires lifting of air mass so that it cools and condenses. . Mechanisms for air lifting. Frontal lifting Orographic lifting Convective lifting. Definitions.


Precipitation
E N D
Presentation Transcript
Precipitation • Precipitation: water falling from the atmosphere to the earth. • Rainfall • Snowfall • Hail, sleet • Requires lifting of air mass so that it cools and condenses.
Mechanisms for air lifting • Frontal lifting • Orographic lifting • Convective lifting
Definitions • Air mass : A large body of air with similar temperature and moisture characteristics over its horizontal extent. • Front: Boundary between contrasting air masses. • Cold front: Leading edge of the cold air when it is advancing towards warm air. • Warm front: leading edge of the warm air when advancing towards cold air.
Frontal Lifting • Boundary between air masses with different properties is called a front • Cold front occurs when cold air advances towards warm air • Warm front occurs when warm air overrides cold air Cold front (produces cumulus cloud) Cold front (produces stratus cloud)
Orographic lifting Orographic uplift occurs when air is forced to rise because of the physical presence of elevated land.
Hot earth surface Convective lifting Convective precipitation occurs when the air near the ground is heated by the earth’s warm surface. This warm air rises, cools and creates precipitation.
Condensation • Condensation is the change of water vapor into a liquid. For condensation to occur, the air must be at or near saturation in the presence of condensation nuclei. • Condensation nuclei are small particles or aerosol upon which water vapor attaches to initiate condensation. Dust particulates, sea salt, sulfur and nitrogen oxide aerosols serve as common condensation nuclei. • Size of aerosols range from 10-3 to 10 mm.
Precipitation formation • Lifting cools air masses so moisture condenses • Condensation nuclei • Aerosols • water molecules attach • Rising & growing • 0.5 cm/s sufficient to carry 10 mm droplet • Critical size (~0.1 mm) • Gravity overcomes and drop falls
Forces acting on rain drop • Three forces acting on rain drop • Gravity force due to weight • Buoyancy force due to displacement of air • Drag force due to friction with surrounding air D Fb Fd Fd Fg
Terminal Velocity • Terminal velocity: velocity at which the forces acting on the raindrop are in equilibrium. • If released from rest, the raindrop will accelerate until it reaches its terminal velocity D Fb Fd Fd Fg At standard atmospheric pressure (101.3 kpa) and temperature (20oC), rw = 998 kg/m3 and ra = 1.20 kg/m3 V • Raindrops are spherical up to a diameter of 1 mm • For tiny drops up to 0.1 mm diameter, the drag force is specified by Stokes law
Precipitation Variation • Influenced by • Atmospheric circulation and local factors • Higher near coastlines • Seasonal variation – annual oscillations in some places • Variables in mountainous areas • Increases in plains areas • More uniform in Eastern US than in West
Spatial Representation • Isohyet – contour of constant rainfall • Isohyetal maps are prepared by interpolating rainfall data at gaged points. Austin, May 1981 Wellsboro, PA 1889
Temporal Representation • Rainfall hyetograph – plot of rainfall depth or intensity as a function of time • Cumulative rainfall hyetograph or rainfall mass curve – plot of summation of rainfall increments as a function of time • Rainfall intensity – depth of rainfall per unit time
Incremental Rainfall Rainfall Hyetograph
Cumulative Rainfall Rainfall Mass Curve
Arithmetic Mean Method • Simplest method for determining areal average P1 = 10 mm P2 = 20 mm P3 = 30 mm P1 P2 P3 • Gages must be uniformly distributed • Gage measurements should not vary greatly about the mean
Any point in the watershed receives the same amount of rainfall as that at the nearest gage Rainfall recorded at a gage can be applied to any point at a distance halfway to the next station in any direction Steps in Thiessen polygon method Draw lines joining adjacent gages Draw perpendicular bisectors to the lines created in step 1 Extend the lines created in step 2 in both directions to form representative areas for gages Compute representative area for each gage Compute the areal average using the following formula A1 A2 A3 P1 = 10 mm, A1 = 12 Km2 P2 = 20 mm, A2 = 15 Km2 P3 = 30 mm, A3 = 20 km2 Thiessen polygon method P1 P2 P3
Isohyetal method • Steps • Construct isohyets (rainfall contours) • Compute area between each pair of adjacent isohyets (Ai) • Compute average precipitation for each pair of adjacent isohyets (pi) • Compute areal average using the following formula 10 20 P1 A1=5 , p1 = 5 A2=18 , p2 = 15 P2 A3=12 , p3 = 25 P3 30 A4=12 , p3 = 35
Inverse distance weighting • Prediction at a point is more influenced by nearby measurements than that by distant measurements • The prediction at an ungaged point is inversely proportional to the distance to the measurement points • Steps • Compute distance (di) from ungaged point to all measurement points. • Compute the precipitation at the ungaged point using the following formula P1=10 P2= 20 d1=25 d2=15 P3=30 d3=10 p
Rainfall interpolation in GIS • Data are generally available as points with precipitation stored in attribute table.
Rainfall maps in GIS Nearest Neighbor “Thiessen” Polygon Interpolation Spline Interpolation
NEXRAD • NEXt generation RADar: is a doppler radar used for obtaining weather information • A signal is emitted from the radar which returns after striking a rainfall drop • Returned signals from the radar are analyzed to compute the rainfall intensity and integrated over time to get the precipitation NEXRAD Tower Working of NEXRAD
NEXRAD data • NCDC data (JAVA viewer) • http://www.ncdc.noaa.gov/oa/radar/jnx/ • West Gulf River Forecast Center • http://www.srh.noaa.gov/wgrfc/ • National Weather Service Animation • http://weather.noaa.gov/radar/mosaic.loop/DS.p19r0/ar.us.conus.shtml