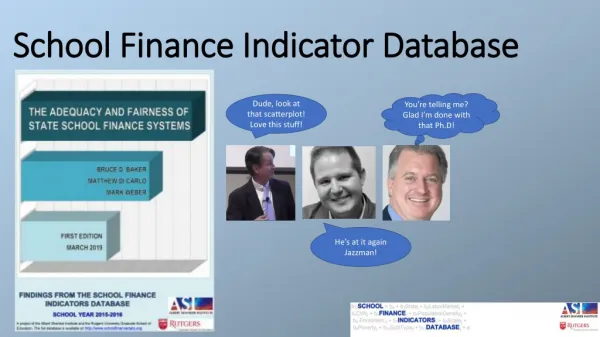
School Finance Indicator Database
School Finance Indicator Database. You’re telling me? Glad I’m done with that Ph.D !. Dude, look at that scatterplot! Love this stuff!. He’s at it again Jazzman!. Core Principles.

School Finance Indicator Database
E N D
Presentation Transcript
School Finance Indicator Database You’re telling me? Glad I’m done with that Ph.D! Dude, look at that scatterplot! Love this stuff! He’s at it again Jazzman!
Core Principles • Proper funding is a necessary condition for educational success: Competitive educational outcomes require adequate resources, and improving educational outcomes requires additional resources. • The cost of providing a given level of educational quality varies by context: Equal educational opportunity requires progressive distribution of resources, targeted at students and schools that need them most. • The adequacy and fairness of education funding are largely a result of legislative policy choices: Good school finance policy can improve student outcomes, whereas bad policy can hinder those outcomes.
Core Indicators • Effort: how much of a state’s total resources or capacity are spent directly on K-12 education; • Adequacy: whether states provide sufficient resources to districts, relative to other states or to common outcome goals (e.g., test scores); • Progressivity: whether states allocate more resources to districts serving larger proportions of disadvantaged children.
Student Population Input Prices Structural/ Geographic Constraints Measured Student Outcomes Cost Spending Inefficiency Efficiency Controls: Fiscal capacity, competition, & public monitoring
Current Average Resources Adequacy Target Exceeds Current Average Actual Distribution Current Average Outcomes Outcomes Equal Opportunity Intercept Adequacy Cost Exceeds Current Average Resources
Current spending (2013-2015) as % of “cost” of achieving national average outcomes (red = lower, green = higher) Current outcomes (2013-2015) with respect to national average outcomes (red = lower, blue = higher)
Progressivity • Substantial progressivity: The ratio of adjusted state and local revenue in higher-poverty districts (10, 20, or 30 percent poverty) to that of the lowest-poverty districts (0 percent poverty) within a given state. • Systematic progressivity: The correlation between revenue and poverty (labor market centered) among all districts within a given state.
Evaluating School Finance Systems • Effort: All else being equal, more effort is better, particularly for states with less capacity. Conversely, however, states with larger economies may not require as much effort as states with smaller economies. • Adequacy: In light of widespread agreement that educational outcomes in the U.S. must improve, we assert, as a general principle, that allocating more resources to schools is better. However, states should also provide resources to schools that are commensurate with achieving common outcomes or improvement toward those outcomes. • Progressivity: States’ allocation of resources should be progressive -–i.e., districts serving more high-needs students should receive more revenue. The optimal degree of progressivity, however, might depend on factors such as the amount of inequality of education outcomes (for example, states with large achievement gaps might allocate resources more progressively)
Resource Indicators • Teacher/non-teacher wage competitiveness: Comparison of teachers’ wages to wages of other professionals in the same state, controlling for factors such as age and education. • Predicted staffing ratios: Teacher-per-student ratios by district poverty adjusted for district size, regional wage variation, and population density. Can be compared with high-and low-poverty districts in each state. • Predicted class size: Average class size by district poverty, for both departmentalized and self-contained classes, adjusted for district size, regional wage variation, and population density. Can be compared with high-and low-poverty districts in each state. • Teacher salary competitiveness: Ratio of actual to predicted teacher salaries, adjusted for degree, experience, and labor market, by poverty (poverty as a percentage of poverty within the labor market). Can be compared with high-and low-poverty districts in each state. • Coverage and charter market share: The number of school-aged students enrolled in public schools as a percentage of all school-aged children, as well as total charter school market share by state (percent of all public school students enrolled in charter schools). • Income-based early childhood schooling gap: The number of 3-and 4-year-olds from low-income families enrolled in school as a percentage of the total number of 3-and 4-year-olds enrolled in school.
Relationships Among Indicators Triangulating Indicators to Characterize State Systems
Relationships to Other Indicators Cutting through the Clutter
The Road Ahead • We need to rally our forces around core principles. Many (most) of us largely agree on the core principles: • Proper funding is a necessary condition for educational success: Competitive educational outcomes require adequate resources, and improving educational outcomes requires additional resources. • The cost of providing a given level of educational quality varies by context: Equal educational opportunity requires progressive distribution of resources, targeted at students and schools that need them most. • The adequacy and fairness of education funding are largely a result of legislative policy choices: Good school finance policy can improve student outcomes, whereas bad policy can hinder those outcomes.
The Road Ahead • We need to clear the clutter when it comes to indicators of state school funding systems • Indicators should address core principles: • Indicators involving spending measures must sort out “good” (equitable, cost-based) variation from “bad” (inequitable) variation • Address regional variation in labor costs • Address economies of scale and population sparsity • Address student need related cost factors • We need to work as a team to help state policymakers understand the relationships among our indicators, and what they say collectively about state school finance systems!