Download
1 / 38
380 likes | 563 Vues
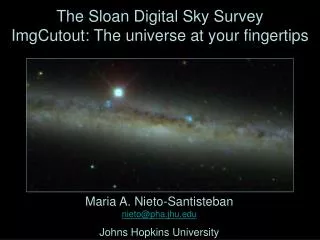
The Sloan Digital Sky Survey ImgCutout: The universe at your fingertips. Maria A. Nieto-Santisteban nieto@pha.jhu.edu Johns Hopkins University. The Sloan Digital Sky Survey ImgCutout: The universe at your fingertips. 1 TByte astronomical database on the internet.

E N D
The Sloan Digital Sky Survey ImgCutout: The universe at your fingertips Maria A. Nieto-Santisteban nieto@pha.jhu.edu Johns Hopkins University
The Sloan Digital Sky Survey ImgCutout: The universe at your fingertips • 1 TByte astronomical database on the internet. • Available to professional astronomers & general public. • A photometric and spectral catalog of 100 million objects.
The big picture of the sky • Each tile corresponds to 5 images taken in different wavelengths by the Sloan telescope. • Originally in FITS format, images are "glued" together to create a JPEG mosaic.
The big picture of the sky • Plates show astronomers the boundaries of spectroscopic observations.
The big picture of the sky • Plates show astronomers the boundaries of spectroscopic observations.
The big picture of the sky • Plates show astronomers the boundaries of spectroscopic observations.
The big picture of the sky • Plates show astronomers the boundaries of spectroscopic observations.
The big picture of the sky • Plates show astronomers the boundaries of spectroscopic observations.
The big picture of the sky • Yellow crosses mark spectroscopic Targets.
The big picture of the sky • Yellow crosses mark spectroscopic Targets. • Red squares indicate actual Spectroscopic observations.
The big picture of the sky • Yellow crosses mark spectroscopic Targets. • Red squares indicate actual Spectroscopic observations. • Blue circles point to Photometric observations.
Looking at data quality • 10 - 15 % of the observations are lost due to bad weather, bright stars, satellite trails, meteors, etc.
Looking at data quality • 10 - 15 % of the observations are lost due to bad weather, bright stars, satellite trails, meteors, etc. • Masks delimit such bad areas.
Looking at data quality • 10 - 15 % of the observations are lost due to bad weather, bright stars, satellites trails, meteors, etc. • Masks delimit such bad areas.
Looking at data quality • 10 - 15 % of the observations are lost due to bad weather, bright stars, satellite trails, meteors, etc. • Masks delimit such bad areas.
Looking at data quality Meteor Trail • Astronomers need to identify bad areas in order to improve their science. Bright Source
Looking at known sources • Astronomers can enter a list of coordinates to get an initial view and decide whether or not proceed further.
Looking at known sources Preparing new observations • Finding charts are invaluable tools when observing with a ‘real’ telescope.
Querying the database for new discoveries Find galaxies with specific spectra: Search for quasars: • Users can search for new objects online and get answers in real time.
Querying the database for new discoveries • These three objects might form a previously unknown lensed quasar!
Querying the database for new discoveries • Photometric data? • Background?
Looking in detail • Digging for more information: • Types and magnitudes • Boundaries
Looking in detail • Digging for more information: • Types and magnitudes • Boundaries • Outlines
Looking in detail • Digging for more information: • Types and magnitudes • Boundaries • Outlines • Photometry, Spectro, Cross Identifications and more …
SkyServer • Photometry, Spectro, Cross Identifications and more from SkyServer
SkyServer • Photometry, Spectro, Cross Identifications and more from SkyServer Quasar Spectrum
Exploring the neighborhood • Select objects.
Exploring the neighborhood • Select objects. • Move around: E – W, N – S.
Exploring the neighborhood • Select objects. • Move around: E – W, N – S.
Exploring the neighborhood • Select objects. • Move around: E – W, N – S. • Recenter.
Exploring the neighborhood • Select objects. • Move around: E – W, N – S. • Recenter. • Zoom in & out.
Exploring the neighborhood • Select objects. • Move around: E – W, N – S. • Recenter. • Zoom in & out.
Exploring the neighborhood • Select objects. • Move around: E – W, N – S. • Recenter. • Zoom in & out.
Exploring the neighborhood • Select objects. • Move around: E – W, N – S. • Recenter. • Zoom in & out.
ImgCutout Visual exploration of • the 1 TeraByte SkyServer database, • its 100 million celestial objects, • their images and spectra, • complex spatial relations, boundaries. Enables instantaneous discoveries.
ImgCutout The Universe at your fingertips… Johns Hopkins University http://skyservice.pha.jhu.edu/dr1/ImgCutout/