Download
1 / 25
260 likes | 450 Vues
Learn about Kaplan-Meier survival curves, log-rank test for group comparisons, and estimating survival probabilities for time-to-event data. Explore sample population data and survival calculations. Contact Dr. Douwe Postmus for more information.

E N D
Kaplan-Meier survival curves and the log rank test Dr Douwe Postmus (d.postmus@umcg.nl)
Content • What makes the analysis of time-to-event data special? • Kaplan-Meier estimator of the survival curve • Log rank test to compare the survival curves between two or more groups
Example • Population: patients admitted to the hospital with symptoms of heart failure (HF) • Outcome: time from hospital discharge to HF hospitalization or death from any cause • Parameter of interest: survival curve S(t) • Proportion of patients with an event time larger than t
Survival curve for the population • Survival curve S(t): proportion of patients in the population with an event time larger than t • 1-year survival: S(1)=0.72 • 2-year survival: S(2)=0.56 • 3-year survival: S(3)=0.45 • 4-year survival: S(4)=0.37 • 5-year survival: S(5)=0.30 • S(t) is generally unknown and needs to be estimated from the data
Random sample of n=1000 • Estimated survival based on the event times in the sample • 1-year survival: 708 / 100 = 0.71 • 2-year survival: 542 / 100 = 0.54 • 3-year survival: 445 / 100 = 0.45 • 4-year survival: 370 / 100 = 0.37 • 5-year survival: 300 / 100 = 0.30
Right censoring • Administrative censoring: the event is observed only if it occurs prior to some pre-specified time • Studies with a fixed follow-up time (e.g., maximum of 2 years per patient) • Studies with a fixed duration (e.g., 5 years between start and end of study) • Loss to follow-up: subjects who drop out from the study before it is terminated
Graphically Start of study End of study x o o censored o x x event x o
How toestimatethe 1-year survival? • For the 578 patients whose event times were observed we know that • 296 survived for more than 1 year • 282 experienced the event within the first year • For the 442 patients whose event times were censored we know that • 332 survived for more than 1 year • 90 either experienced the event within the first year or survived for more than one year
1-year survival: lowerandupperbounds • Lower bound: count the 90 patients who either experienced the event within the first year or survived for more than one year as if they experienced the event • Upper bound: count the 90 patients who either experienced the event within the first year or survived for more than one year as if they survived
Estimationbased on conditionalprobabilities Hazard: probability of experiencing the event within the interval conditional on being alive at the start of the interval
Kaplan-Meier estimator • Survival curve estimated based on conditional probabilities • Takes all the unique event and censoring times and sorts them in ascending order (from low to high) • Uses the periods between the sorted event and censoring times as the intervals
KM survival curve for the example (time in days instead of years)
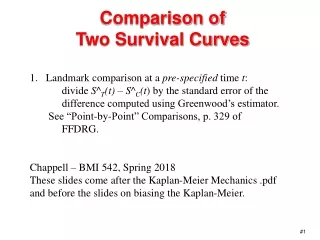
Limitations of thelog rank test • The log rank test canbeusedtocomparethe survival curves of two or more groups • Stratification can be used to adjust for the effect of a second categorical covariate • Treatment effect adjusted for gender (i.e., separate survival curves for male and female patients) • Examples of research questionsforwhichthelog rank test cannotbeused • Is ageassociatedwiththe time to HF hospitalization or deathfromanycause? • Treatment effect adjustedforseveralcovariates