Download
1 / 57
570 likes | 719 Vues
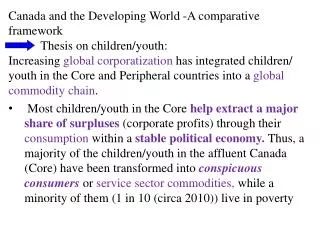
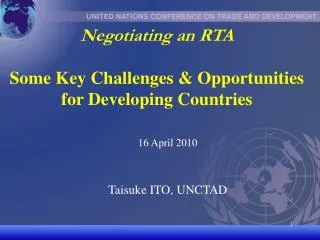
Negotiating an RTA Some Key C hallenges & Opportunities for Developing Countries. 16 April 2010 Taisuke ITO , UNCTAD. Outline. N orth-South RTA negotiations DCs m arket opening at home Market access in the partners Deep integration issues S outh-South integration & cooperation

E N D
Negotiating an RTASome Key Challenges & Opportunities for Developing Countries 16 April 2010 Taisuke ITO, UNCTAD
Outline • North-South RTA negotiations • DCs market opening at home • Market access in the partners • Deep integration issues • South-South integration & cooperation • State of play, its role & potential
1. Policy Issues in RTAs (1) • RTAs here to stay – How to make them useful for development while minimizing the costs? • Trade creation & diversion = TC>TD leads to net welfare gains • TC = source of efficiency gains but short-term adjustment challenge (like any trade liberalization) • TD = efficiency loss, challenge for RTA members and affected non-members • Need to assess trade diversion relative to the non-static benefits of increased trade
Policy Issues in RTAs (2) • Dynamic Effects • Economies of scale, pro-competitive effects, FDI, ToT, positive externalities from institutional changes • Deep integration • Increase the likelihood of dynamic gains • But upward regulatory harmonization entails implementation costs (unlike tariffs) and can be sub-optimal for “non-best practice” DCs (WTO-plus) • And deeper commitments on broader coverage of behind-the-border regulatory issues may limit domestic “policy space”
2. North-South RTAs: Why Significant? • Reciprocal, as against non-reciprocal • Adjustment costs important as DCs tend to have higher tariffs, import dependence, dependence on tariffs on government revenue • Limited scope for improved market access • Low MFN rates & unilateral preferences in DDCs • Deep integration under “new generation” RTAs • Broader coverage of behind-the-border measures
Effects of trade liberalization – ExampleNigeria’s 100% liberalization vis-à-vis the US (SMART simulation) Source: TRAINS/WITS
(1) Market Opening in Developing Countries • Import surge, de-industrialization /food security & revenue loss concerns • Lesser & slower liberalization as SDT in RTAs to mitigate adjustment costs, but • The degree of such flexibility constrained by GATT Art XXIV requirement (“Substantially all the trade”), ie, 90% over 10 years. EPAs evolved around 80% over 15 years (EU) • How to design product coverage & schedules under the WTO legal constraint? How does it matter?
How to determine “Sensitive” Products? • Objectives • To protect domestic industry from import competition • To minimize tariff revenue loss • SAT constraints = Min. 80-90% volume & t-line coverage • By which benchmarks? • Products with high dutiable imports • Products protected with high tariffs with high imports • Products facing large theoretical tariff revenue loss (MFN rates/100 *import value) • Minimizing import surge (overall & by product) • Minimizing tariff revenue loss • Maximizing consumer surplus (welfare) - memo
Products with the highest dutiable import value Source: TRAINS/WITS
(b) Products with the highest tariffs & imports Source: TRAINS/WITS
(c) Products with the highest theoretical tariff revenues Source: TRAINS/WITS
(d) Import Surge Minimization (SMART) Source: TRAINS/WITS
(e) Tariff Revenue Loss Minimization (SMART) Source: TRAINS/WITS
Summary • Import-surge minimization line-by-line basis captured products with very low level of initial imports • Consumer surplus maximization - by design, captured lowest imported items, hence the large numbers chosen. • Caveat – only illustrative for estimates based on simulation Source: TRAINS/WITS
Implications • Not straightforward exercise – depends on individual trade & tariff structures • Static & dynamic perspectives complementary, to be combined with other considerations – domestic production, direct competition, employment, social sensitivities etc • Import concentration in a few lines affect the choice • High tariff protection approach, the favored one? • SAT requirement limits the selection • In case of regional groupings, harmonizing with other countries further complicates the task – lack of overlap (EPAs) • Staging & speed of liberalization yet another issue • WTO interface – Rules negotiations on SAT
Note: EPA Liberalization Schedules (Value) Source: ECDPM
Note: EPA Liberalization Schedules (Tariff Lines) Source: ECDPM
(2) Market Access in RTA Partners • New MA opportunities limited due to already low tariffs in DDCs (SSA, LDCs). Not so much so for non-LDCs? • Excluded sectors often sensitive and politically difficult either in RTAs or MTN • Statutory prohibition on “import sensitive AG product” (US TPA) / Hierarchy of preferences (EU) • How have existing RTAs dealt with such “sensitive” products? Any lessons? • 3 US RTAs - Bahrain, Jordan, Morocco (Oman) • 6 EU RTAs - Algeria, Egypt, Jordan, Morocco, Tunisia, Turkey
US Tariff Treatment 2008 by Regime (Total 10047) 84% for LDCs, 91% for AGOA (2007) Source: TRAINS/WITS
US RTA Product Coverage of MFN & GSP Dutiable Lines, 2008 (Total 3264) Source: TRAINS/WITS
US - Frequency of “Sensitive” Products by HS Chapter (DF under no or 1 RTAs, total 526) Source: TRAINS/WITS
US MFN Tariffs 2007 (Simple Av, incl. AVEs) Source: TRAINS/WITS
How do they affect actual exports?US MFN & Effective Rates, 2007 (Weighted av.) Source: TRAINS/WITS
The “sensitive” products affect DC exportsShare of US Duty-Free Imports, 2007 Source: TRAINS/WITS
US Tariff Treatment of Jordan’s Major Exports, 2007 Source: TRAINS/WITS
US Actual & Potential “Value” of Preferences, 2007 (Tariffs saved, % of dutiable imports) Source: TRAINS/WITS
Summary • Tariff line coverage is high for all 3 RTAs. Morocco FTAs, & other to a lesser extent, still in implementation • All provide significantly greater coverage than GSP • The coverage is lower in the import value terms • Excluded or back-loaded are dairy, processed foodstuffs & apparels, where tariffs are still high • The exclusion of apparels have significant implications, particularly for Jordan • But it is also the sector where preference margins are high, & concentration of exports in the sector resulted in high “value” of preferences for Jordan even if it has very low DF trade coverage • Fuller coverage could have increased preference value, particularly in Jordan
EU Tariff Treatment by Regime, 2008 (Total 14238) Source: TRAINS/WITS
Note: EU DF Product Coverage by Regime (Total 14310) Source: TRAINS/WITS
EU RTA Product Coverage of MFN & GSP Dutiable Lines, 2008 (Total 6241) Source: TRAINS/WITS
EU - Frequency of “Sensitive” Products by HS Chapter, 2008 (DF in no or 1 RTAs, total 1308) Source: TRAINS/WITS
EU MFN Tariffs 2007 (Simple Av, incl. AVEs) Source: TRAINS/WITS
How do they affect DC exports? Not so much?EU MFN & Effective Rates, 2007 (Weighted av.) Source: TRAINS/WITS
Share of EU Duty-Free Imports, 2007 Source: TRAINS/WITS
EU Actual & Potential “Value” of Preferences, 2007 (Tariffs saved, $000) Source: TRAINS/WITS
EU Actual & Potential “Value” of Preferences, 2007 (Tariffs saved, % of dutiable imports) Source: TRAINS/WITS
Summary • Tariff line coverage in EU RTAs is lower than US RTAs, as low as 80% for Egypt, less than 90% for Algeria, Morocco, Tunisia (may be yet to be implemented) • Significantly better than GSP but lower than LDCs • “Sensitive” products concentrate on Agriculture • By contrast, the coverage is higher on import volume terms, unlike US RTAs, all above 90% (olive oils, vegetables, fruits) • Significant preference margins, thus preference value, especially for Turkey. Caveat – EU has competing RTAs, so preference margin & value can be an overestimate • Some potential remain for improved preference for Egypt, Morocco, Tunisia & Jordan, not so much for Turkey
Implications • The design of product coverage and staging matter for DC export opportunities • Innovative approach & lessons • Tariff reduction, longer period, longer than 10 years for fuller liberalization? • Preferential TRQ, expansion and tariff elimination for key products • MFN reduction – Preference erosion but may gain where products not covered or utilized
Not all Preferences are utilizedTentative estimates of the utilization rates of Quad unilateral preferential schemes by LDCs, 2007 Source: GSP database
Rules of Origin (1) • Determine the eligibility for preferential treatment => can be trade policy instrument • Insulate an industry from the RTA consequences, to attract investment in strategic sectors like TRIMs • Raise production cost by protecting intermediate good producers (resultant distortion = 4.3% tariffs) • Also compliance cost (1.8% under NAFTA) • Restrictive rules hampers the use of preferences • Often more restrictive in N-S than in S-S RTAs
Rules of Origin (2) • Wholly obtained • Substantial transformation, as measured by • Change in tariff classification • Regional value-added • Specific processing requirement • Some restrictive rules • High local content requirement (60%) • T&C – “yarn-forward”/double transformation • Processed foodstuff – raw materials to be wholly obtained • Fish taken outside territorial waters – “vessels” – registration, flag, ownership, crew
Rules of Origin (3) • Facilitated use of non-originating input to qualify for RTA RoO in key products • Time-bound exemption /“RoO-free quota” • Phase-in implementation • Lower thresholds in VA rules for DCs • Use of non-originating row materials for processing • Optional rules for processed AG • Single transformation for apparels • Broader & fuller cumulation (Paneuro) • Higher tolerance rules • But RoO also reciprocal – balancing act needed
Other NTBs • SPS/TBT Standards • Products may be covered but can be totally restricted (QR) • Harmonization/equivalence/MRAs => difficult in N-S context? • Cooperation in conformity assessment & certification? • SG/AD/CVM • As per WTO requirement? Some eliminated AD for RTA partners • SG – bilateral SG with elements of asymmetry + exclusion from global SG? • AG subsidies • Basically WTO issue, but need to be factored in • Not to target export subsidies to RTA partners exports, zero-for-zero (EPAs) & prohibition of new subsidies
(3) Deep Integration Issues • Services • Binding existing regime, investment focus (M3), financial, telecom • Limited M4 & labour mobility (high-skill labour, intra-corporate transferees etc) • Intellectual property rights • TRIPS-plus, to be applied on an MFN basis • Investment • Liberation, investor protection vs Investment promotion & cooperation • Competition policy • CP law (state aid, adoption of CPL) vs cooperation • Government procurement • MA interests vs asymmetric supply capacity.
3. South-South RTAs • Reinvigoration of SS RTAs - broader economic cooperation • S-S trade dynamic, now nearly 50% of DC trade • Mostly intra-regional – distance matter. Role of regional arrangements • Limited complementarily, small markets, limited liberalization traditionally noted • More positive views as many engaged in SS RTAs • What are the “realities”?
Intra-RTA trade generally lower in SS RTAsIntra-RTA Trade Share (2008) Source: UNCTAD GlobStat
But grew faster in many SS RTAs Av Annual Change in Intra- & Extra-RTA Exports: 2000-08 Source: UNCTAD GlobStat