Download
1 / 26
260 likes | 445 Vues
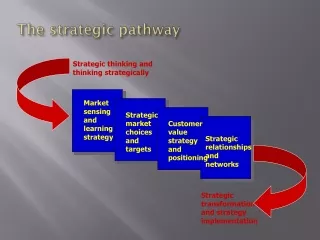
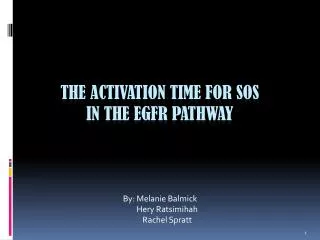
By: Melanie Balmick Hery Ratsimihah Rachel Spratt. The activation time for sos in the egfr pathway. Uncontrolled cell proliferation is a characteristic of cancer. EGF mediated pathways found in pancreatic and lung cancers. Pancreatic cancer is hard to diagnose & cure.

E N D
By: Melanie BalmickHeryRatsimihah Rachel Spratt The activation time for sosin the egfr pathway
Uncontrolled cell proliferation is a characteristic of cancer EGF mediated pathways found in pancreatic and lung cancers.Pancreatic cancer is hard to diagnose & cure.
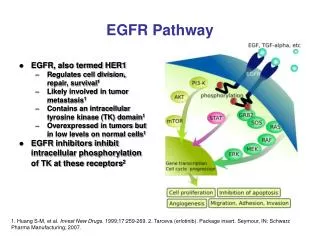
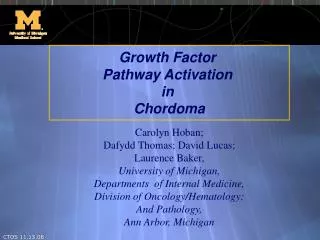
The EGFR Pathway -EGFR Pathway: a pathway involved in cell proliferation. -EGF binds to EGFR in the cell membrane, dimers, when phosphorylated, pass protein mediated in the cell. -Activated Tyrosine kinases have become targets of chemotherapy drugs on the market.
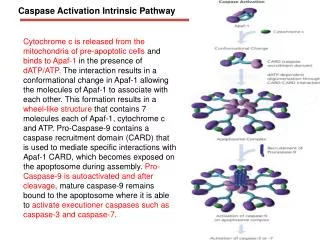
Ratcheting Effect of Protein Mediated Cascade Activated Sos takes a GDP from the Ras protein which in turn creates transcription factors which can enter the cell nucleus.
The Template: As It Is ZOOM The first peak in Sos represents it’s activation. Graphically, this is how we find the amount of time it takes for Sos to be activated.
Varying the Ligand: EGF Increase EGF Faster Activation *Averages are calculated from running 100 stochastic simulations for each of the above concentration of EGF.The units of time are unspecified.
Statistically Significant? µ1 = 2.2e6 (more EGF) µ2 = 1.2e6 (original amount)Degrees of Freedom: Infinity
True Population Mean for [ EGF ]95% Confidence Intervals For 95% Confidence, t = 1.98
EGF Frequency Histograms Mean: 0.152Median: 0.151Std. Dev.: 0.040 Mean: 0.313Median: 0.313Std. Dev.: 0.078
EGF Frequency Histograms, Continued Mean: 0.251Median: 0.313Std. Dev.: 0.250 Mean: 0.210Median: 0.202Std. Dev.: 0.060
EGF Frequency Histograms, Continued Mean: 0.196Median: 0.195Std. Dev.: 0.047
Reading a CDF Probability Distribution CDFs are interpreted like this:P( Act. Time) 0.3 40%
EGF Probability Distribution The translation of CDF curves, due to the change in concentration, illustrates how concentration effects Sos activation time.
VaryingK-Value for EGF Binding (Kp1) Decrease Rate Longer Time *Averages are calculated from running 100 stochastic simulations for each of the aboveK-Values..The units of time are unspecified.
Statistically Significant? µ1 = 4.0e-5 (faster) µ2 = 1.667e-6 (original) µ3 = 1.667e-7 (slower)df = infinity
Kp1 Probability Distribution Mean: 0.125Median: 0.123Std. Dev.: 0.038 Mean: 0.234Median: 0.239Std. Dev.: 0.060
Kp1 Probability Distribution, Continued Mean: 0.258Median: 0.256Std. Dev.: 0.063 Mean: 0.315Median: 0.300Std. Dev.: 0.071
Kp1 Probability Distribution, Continued Mean: 0.692Median: 0.681Std. Dev.: 0.151
True Population Mean for Kp195% Confidence Intervals For 95% Confidence, t = 1.98
Issues EGFR = HUGE ModelGenerating the model network was time and resource heavy. Generated files > 5GB for each individual simulation. Ie. Took > 10 minutes/ simulation. Multiplied by 100 = 500GB of data generated in > 16 hours.Multiplied by 8 (# of tested parameters) = 4TB in 128 hours.
Solution Results: 100 simulations = 5GB -In 1*5mn + 99*1mn = less than 2 hours -On 1 computer: 40Gb in 16 hours -On 8 computers: 5GB/comp in 2 hours total Both:Use multiple computers
Conclusions 1- Sos activation is significantly changed when [EGF] and Kp1 are changed.2- Our expectations were parallel to what our conclusions showed: A. With increasing ligand available, Sos is activated quicker. B. When rate that which EGF binds to the monomer is increased, Sos is activated quicker and vice versa.3- Attempting this project individually is near impossible. Collaboration between people in different fields is necessary.
Thank you! MANY THANKS TO THE FOLLOWING PEOPLE: Nancy Griffeth Terri Grosso-Applewhite AronWolinetz Kai Zhao James Faeder The National Science Foundation And all of our fellow colleagues