Download
1 / 60
600 likes | 837 Vues
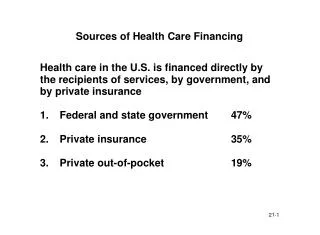
Financing, Access, Quality and Outcomes in Primary Health Care: The case of the Republic of Kazakhstan. Mr. Aikan Akanov, Director of the Healthy Lifestyle Promotion Centre VII CARK MCH Forum Almaty, Kazakhstan 5 - 7 November 2003. Agenda.

E N D
Financing, Access, Quality and Outcomes in Primary Health Care:The case of the Republic of Kazakhstan Mr. Aikan Akanov, Director of the Healthy Lifestyle Promotion Centre VII CARK MCH Forum Almaty, Kazakhstan 5 - 7 November 2003
Agenda • Overview of trends in health status: Kazakhstan and FSU countries • Access and Quality in PHC Kazakhstan • Financing primary health care in Kazakhstan • What drives outcomes? • Where do we go from here?
Challenges to Health Systems: Conceptual Framework Means Intermediate Goals Final Goals A B C • Changes in: • Regulation • Financing-Pooling • Purchasing • Delivery Models Equity & Access Health Status Effectiveness & Quality Financial Risk Protection Financial sustainability Efficiency & Productivity Social responsiveness Satisfaction
Discrepancy of IMR Data: Official and Independent Studies Official Statistics indicates the Infant Mortality Rate at 18 per 1,000 live births. While the Demographic and Health Survey indicates 62 per 1,000 live births. This could be explained by use of different live birth definitions.
Probability of dying before age 5 years per 1000 live births 60 50 Azerbaijan 40 Bulgaria Czech Republic France Hungary Kazakhstan 30 Russian Federation Ukraine United Kingdom EU average CARK average EUROPE 20 10 0 Last Available Under 5 mortality
Deaths from injuries in childhood(age 0-14) Death rate/100,000 60 55 50 45 Kazakhstan 40 Russia 35 Uzbekistan 30 Ukraine 25 Lithuania 20 Source: WHO 1980 1985 1990 1995 2000
12 Lithuania 11 10 9 8 Ukraine 7 Russia 6 5 4 3 EU average 2 1980 1982 1984 1986 1988 1990 1992 1994 1996 1998 2000 Preventive and Diagnostic Services Are Limited Age standardised death rate, cancer of the cervix, age 0-64, per 100,000 Cervical cancer – a combination of factors • Probable increase in incidence, reflecting rise in STDs • Failure of screening programmes • Lots of Pap smears • Inadequate training • Inadequate quality control • Inadequate follow up Kazakhstan
Scope of Primary Care Practice • Diagnostic & Therapeutic Care • Acute care • 24 hr coverage • Chronic disease management • Prescriptions • Psycho-social care • Specialty referrals • Worker health • Home-based care • Palliative • Pain management • Other symptoms • Coordination/Referrals • Nursing home care • Hospice Dx and Therapeutic Palliative Rehab Preventive • Rehabilitation • Coordination/Referrals • Alcohol and drug • Physical therapy • Occupational therapy • Specialty referrals • Convalescent care • Preventive Services • Screening • Risk factor identification & mgt. • Immunization • Well child care • Prevention counseling • Family Planning
Objectives of the Study on Access to and Quality of PHC Services • How do patients use the network of facilities, including the evaluation of the capacity of primary health care facilities? • Is the use of appropriate treatment protocols and the knowledge of providers and patients adequate to contribute to reductions in infant and maternal mortality? • Does the need to pay for pharmaceuticals and other out-of-pocket payments contribute to problems with access to appropriate services?
Percent of patients paid for the treatment PHC Hospital Average payment – 2,011 KZT Average payment – 6,630 KZT
Average Cost of Hospital Treatment Compared to Percent of People’s Monthly Income % of income Average monthly income
Average Cost of PHC Treatment Compared to Percent of People’s Monthly Income % of income Average monthly income
% of patients that paid for treatment in the hospital (hospital, consult, medications, analysis and other)
…and how does this compare with protocol 6 or more = 47%
During the pregnancy, were you given or did you buy iron tablets/ injections?
% Procedures been done at least once to all adult members of your household by level of income
Quality of Care: Use of Protocols q321-eclampsia Q-321 Referral 37 30.1 Count Column % procedures hospital/women's clinic Q-321 Medicines to 24 19.5 lower blood pressure Q-321 Diuretics provided 37 30.1 Q-321 Management 44 35.8 strategy Q-321 Blood pressure 60 48.8 taken Q-321 Pulse taken 44 35.8 Q-321 Diuresis 34 27.6 Q-321 Deep tendon 11 8.9 reflexes Total 123 100.0
Total health expenditure as % of gross domestic product GDP Switzerland Germany France Greece Portugal Malta Netherlands EU average Israel Sweden Denmark Italy Norway Nordic average Slovenia United Kingdom Spain Czech Republic Finland Hungary Ireland EUROPE CSEC average Slovakia Lithuania Estonia Latvia Belarus Ukraine CIS average Republic of Moldova Uzbekistan Kyrgyzstan Kazakhstan Azerbaijan 0 5 10 15 2001 International Comparison as % GDP on Health
Resource allocation rules are not oriented to population health needs and risk of illness. Spending is not allocated to most cost-effective interventions. No clear budgeting rules across oblasts. Budget structure does not allow for the clear separation of primary care expenditures, versus secondary and hospital care. Main findings on the financing and budgeting study
No common budget structure across oblasts leads to difficulty in comparing spending. Capital spending is very low and is crowded out by spending on salaries and other spending. Spending on drugs is not standardized to a unique formulary and drug prices are not referenced. Main findings on the financing and budgeting study
IMR and Spending Spending per capita is not allocated according to need but has a small, positive impact on IMR.
MMR and Spending …with similar results in terms of MMR and…
Infrastructure and IMR Total number of FAPs is positively associated with lower levels of IMR and …
IMR and Medical/Obstetric Units …similar results in terms of medical/obstetric units---better access means fewer infant deaths.
IMR vs. Beds per 10,000 IMR is negatively correlated with beds per 10,000. This means that more beds is associated with a higher IMR
Conclusions • Outcomes appear to be linked to elements that improve access to MCH services (more FAPS and more obstetric units). • Outcomes in IMR/MMR/Anemia are not linked to financing or to inputs. In some cases, outcomes are worse where inputs are greater. • Improved outcomes depend on better access and quality of care. • Resource allocation formulas should to take into account a population needs based formula.
Challenges to Health Systems: Conceptual Framework Means Intermediate Goals Final Goals A B C • Changes in: • Regulation • Financing-Pooling • Purchasing • Delivery Models Equity & Access Health Status Effectiveness & Quality Financial Risk Protection Financial sustainability Efficiency & Productivity Social responsiveness Satisfaction
Equity and Access Distribution of funds not allocated according to population needs. Equity in outcomes is limited as a very small % of women in lowest income groups meet standards of care in key protocols In general people have access to health services…but… Geographic access to well developed PHC is limited and forces many rural people into hospitals as first line provider. Financial access is a problem. Out-of-pocket payments, many times in excess of a monthly salary, keep 20% of all patients from obtaining required medical care. Access to quality medical services in rural areas is impeded as years of under investment have eroded the technical capacity of providers. Assessing overall performance