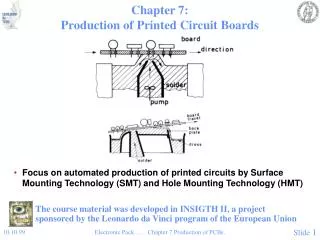
Chapter 20: Production and Costs
840 likes | 1.13k Vues
Chapter 20: Production and Costs. economic costs & profits short run long run. big picture. understand behavior of firm understand & measure production costs. I. economic costs & profits. firm’s goal: maximize profit look at factors that affect firm’s decision. economic costs.

Chapter 20: Production and Costs
E N D
Presentation Transcript
Chapter 20: Production and Costs • economic costs & profits • short run • long run
big picture • understand behavior of firm • understand & measure • production • costs
I. economic costs & profits • firm’s goal: maximize profit • look at factors that affect firm’s decision
economic costs • opportunity cost of resources used • explicit costs • paid in money • wages, rent, material, etc. • implicit costs • opportunity cost of resources used
example: smoothie shop • explicit costs: • wages • interest on loan • rent on store • fruit, blenders
implicit costs • forgone interest on funds used to buy capital • owner’s forgone wages • owner’s forgone profit from other venture
accounting profit • total revenue – explicit costs • ignores opportunity cost
economic profit • includes opp. costs = total revenue - total costs = (price)(quantity) - (explicit + implicit costs)
normal profit • occurs when • amount of accounting profit = opportunity costs of resources • if earning a normal profit, • economic profit = 0
Short Run vs. Long Run • Short Run (SR) • time frame where some resources are fixed -- plants, equipment • some inputs variable -- labor • SR decisions are reversible
Long Run (LR) • time frame where all inputs are variable --build a bigger plant • LR decisions are hard to reverse -- cannot easily get rid of capital -- sunk cost
II. SR Production • measures of output • total product • marginal product • average product
total product (TP) • total quantity of good produced in a given period • at first, increases with labor, then falls
TP: gal. of smoothies per hour # workers TP 0 1 2 3 4 5 6 7 0 1 3 6 8 9 9 8
9 5 6 TP # workers
marginal product (MP) • change in TP due to one more worker change in TP = change in labor
At first MP rises with workers • add more workers • greater specialization • MP of each worker added is larger than previous worker • increasing marginal returns
then, MP falls with more workers • keep adding workers • but same amount of capital • so eventually get in the way • MP of more workers smaller than MP of previous workers • decreasing marginal returns
1 2 3 2 1 0 -1 TP, MP: gal. of smoothies # workers TP MP 0 1 2 3 4 5 6 7 0 1 3 6 8 9 9 8
3 0 3 MP Q = # workers
law of decreasing returns • As firm uses more labor • with capital fixed, • MP of labor will eventually fall
Average Product (AP) TP = labor = productivity
1 2 3 2 1 0 -1 AP # workers TP MP 0 1 2 3 4 5 6 7 0 1 3 6 8 9 9 8 1 1.5 2 2 1.8 1.5 1.1
3 0 3 MP AP # workers
MP & AP • MP intersects AP at max of AP • why? • MP > AP • AP is rising • MP < AP • AP is falling
III. SR cost • measure cost 3 ways: • total cost • marginal cost • average cost
Total Cost (TC) • cost of all factors used • total fixed cost (TFC) • cost of land, capital, etc. • does not change in SR • total variable cost (TVC) • cost of labor • changes in SR • TC = TFC + TVC
example : yogurt • labor = $6/ hour • TFC = $10/ hour
workers TP TFC TVC TC 0 0 10 0 10 1 1 10 6 16 1.6 2 10 9.6 19.6 2 3 10 12 22 10 10 4 5 8 9 24 30 34 40
TC TC TVC TFC 10 Q = output
Marginal Cost • change in TC due to one-unit increase in output (Q) change in TC = change in Q
TP TFC TVC TC 6 3.6 2.4 6 MC 0 10 0 10 1 10 6 16 2 10 9.6 19.6 3 10 12 22 10 10 8 9 24 30 34 40
Average Cost (ATC) • = TC/Q • average fixed cost (AFC) • (TFC/Q) • average variable cost (AVC) • (TVC/Q) • ATC = AFC + AVC
TP TFC TVC TC AFC AVC AC 0 10 0 10 1 10 6 16 10 6 16 2 10 9.6 19.6 5 4.8 9.8 3 10 12 22 3.33 4 7.33 10 10 1.25 3 4.25 8 9 24 30 34 40 1.11 3.33 4.44
AC, MC MC ATC AVC AFC Q = output
MC & AC • MC intersects AC at its minimum • MC < AC • AC is falling • MC > AC • AC is rising
AC is U-shaped • why? • AFC falls with Q • AVC falls then rises • decreasing marginal returns • so ATC falls, then rises
cost & product curves • when MP is at maximum, MC is at minimum • when AP is at maximum, AVC is at minimum
what shifts cost curves? • technology • make more with same inputs • shifts TP, MP, AP up • changes ATC curve
changes in factor prices • increase fixed costs -- TFC, AFC shift up -- TC shift up • increase wages (variable) -- TVC, AVC, MC shift up -- TC shift up
IV. LR costs • all inputs (and costs) are variable • what happens if increase plant AND labor by 10%? • ATC fall? • ATC rise? • ATC stay same?
Economies of scale • increase inputs 10% • output increase > 10% • ATC falls • why? • gains from specialization -- labor -- capital
Diseconomies of scale • increase inputs 10% • output increase < 10% • ATC rises • why? • too hard to control large firm
Constant returns to scale • increase inputs 10% • output increase = 10% • ATC stays same
LR Average Cost (LRAC) • lowest average cost when all inputs are variable • SRAC curves from different plant sizes
AC ATC1 ATC2 ATC3 ATC4 Q = output LRAC
AC ATC1 ATC2 ATC3 ATC4 Q = output diseconomies of scale economies of scale constant returns to scale
summary: • costs = implicit + explicit • SR, only labor variable • LR, all inputs variable • Production & costs • total, marginal, average • fixed, variable
The importance of the firm’s production function, the relationship between quantity of inputs and quantity of output • Why production is often subject to diminishing returns to inputs • The various types of costs a firm faces and how they generate the firm’s marginal and average cost curves • Why a firm’s costs may differ in the short run versus the long run • How the firm’s technology of production can generate increasing returns to scale