Download
1 / 33
330 likes | 494 Vues
Active Remote Sensing in the Baltimore-Washington DC Metropolitan Area: UMBC Monitoring of Atmospheric Pollution (UMAP). Ruben Delgado , Jaime Compton, Daniel Orozco, Patricia Sawamura, Kevin Majewski, Timothy Berkoff , Kevin J. McCann, and Raymond M. Hoff Atmospheric Lidar Group

E N D
Active Remote Sensing in the Baltimore-Washington DC Metropolitan Area: UMBC Monitoring of Atmospheric Pollution (UMAP) Ruben Delgado, Jaime Compton, Daniel Orozco, Patricia Sawamura, Kevin Majewski, Timothy Berkoff, Kevin J. McCann, and Raymond M. Hoff Atmospheric Lidar Group University of Maryland-Baltimore County 2011 National Air Quality Conference, San Diego, CA
UMBC Atmospheric Lidar Group • Remote sensing studies of the atmosphere with lidar measurements to determine the vertical distribution of aerosols (natural and anthropogenic) and water vapor. • Lidar activities at UMBC support NOAA CREST Lidar Network, WMO-GALION, Maryland Department of the Environment and NASA and NOAA satellite calibration/validation measurements. • Understanding optical, chemical and physical properties of atmospheric aerosols and gases. • The integration of atmospheric aerosol measurements into practical tools contributes to informed policymaking on issues of air quality, long-range transport of pollutants and climate change .
Profiling Air Quality over Baltimore UMBC Monitoring of Atmospheric Pollution (UMAP) http://alg.umbc.edu/umap
Air Quality: Pollutant Transport • Difficulty to determine sources contributing to local pollution. Aerosols remain in the environment for long periods and can be transported by winds globally. The air we breathe is strongly affected by local-to-regional-to-global pollution sources. • Atmospheric and pollution dynamics aloft are missed by surface instruments. Insight into processes influencing the fate of pollutants in the atmosphere. • Transport aloft is important during pollution events: pollutants aloft mix down increasing surface concentrations.
Planetary Boundary Layer • Particle pollution and gases are primarily trapped within the PBL. • Aerosols can be used as tracer of height and dynamics within PBL.
Planetary Boundary Layer • Diagnostic variable atmospheric transport and dispersion forecasting models. • Without realistic PBL heights models have large errors that result in inadequate public protection against unhealthy air quality. • National Research Council has recommended a “network of networks”1 • After 60 years of remote sensing research, it is astounding that the PBL is not measured regularly throughout its diurnal cycle 1- NRC. 2009. Observing Weather and Climate from the Ground Up: A Nationwide Network of Networks. Washington, DC: National Academy Press.
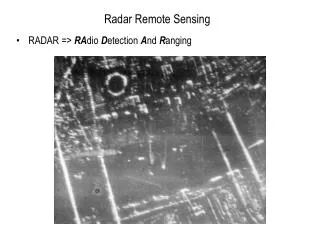
Trans-Pacific Transport of Asian Dust • Strong winds, associated to frontal activity, provide a mechanism of injection of soil (sand) from the Gobi and Taklimakan deserts into troposphere [Merrill et al., 1989]. • Asian dust contributes 0.2-1.0 µg m-3 of the total PM2.5 mass concentration in North America, with higher frequency of transport during spring (March-May) [VanCuren and Cahill, 2002]. • Dust particles affect the concentration of gaseous pollutants and secondary aerosols components by acting as condensation surfaces and catalysts in heterogeneous reactions [Dentener et al., 1996; Wang et al., 2007].
AIRS Infrared Dust Flag Product April 2006 Date Date Date DeSouza-Machado et al., GRL, 33, L03801, 2006.
IMPROVE Aerosol Monitoring Network Ca: April 20, 2006 PM2.5 dust = 2.2[Al] + 2.49[Si] + 1.63[Ca] + 2.42 [Fe] + 1.94[Ti]. Malm et al., J. Geophys. Res. 1994, 99, 1347–1370.
North Carolina Wildfires June 10 June 11 Smoke June 12 June 13 http://rapidfire.sci.gsfc.nasa.gov/subsets/
Smoke from biomass burning: • Increase PM2.5 directly by injecting carbonaceous aerosols into the atmosphere. • Increase ozone indirectly by increasing carbon monoxide (CO), nitrogen oxides (NOx), and volatile organic compounds (VOCs). • McKeen et al. (2002): J. Geophys. Res., 107, D14, 4192. • Ozone enhancements (20-30 ppb) due to wildfire emissions. Increase due to the transport of NOx and ozone formed in the plume.
Nocturnal Low Level Jets (NNLJ) • The NLLJ occurs between 00:00 and 7:00 AM and has the following characteristics: - Generally located between 300 and 1000 m in altitude - S-SW wind maximum in the residual layer of 10–20 m/s. - Veering winds (turning from S to W) from the surface up through the NLLJ core. • The turbulence generated by this wind shear can induce nocturnal mixing events and enhance surface-atmosphere exchange, thereby influencing the dispersion of pollutants near the surface. Taubman et al., J. Atmos. Sci., 61, 1781-1793, 2004. Delgado et. al., Atmos. Chem. Phys., 2010.
NLLJ Formation • Forms between the Appalachian Mountains & Atlantic Ocean. • Sunset: ground cools/air poor conductor of heat/air close to ground cools too (~100 meters). • Air over mountains cools more than air at same elevation near coast. • Temperature gradient induces a southerly wind a few hundred meters above the ground. Cool Air Warm Air
WRF June 14 07:00 UTC The transport of the smoke to the US Mid-Atlantic States caused 24-hour PM2.5 concentrations to reach 2008 US National Ambient Air Quality Standards (NAAQS) exceedance levels (>35 mg/m3).
Chemical Analysis of 24-hour PM2.5 (mg m-3) in Maryland Organic Carbon and Potassium are markers for Biomass Burning.
Winter Pollution Events -Surface temperature inversions play a major role in air quality, especially during the winter. -The warm air aloft on top of cooler air acts like a lid, suppressing vertical mixing and trapping the cooler air at the surface. -Inversion traps pollutants near the ground, leading to poor air quality.
Size Distribution: Coarse Particle Component Single Scattering Albedo: Aerosols/Dust like signature
Baltimore PM2.5 Hourly Timeseries PM2.5 [mg m-3] Morphology and Elemental Composition PIXE @ Univ. of Sao Paulo SEM @ UMBC
Forest fires June 14, 2008 Dust April 17-20, 2006 Urban Aerosols P.B. Russell et al., Atmos. Chem. Phys., 10, 1155-1169, 2010.
Summary • Vertical and temporal resolution of lidar allows: • -Assessment of long range transport of natural and anthropogenic aerosols vs. local sources to local air quality. • -Aid source allocation of particle pollution for during Air Quality Action Days. Evidence for Exclusion of Air Quality Exceedance due to Exceptional Events. • -Continuous monitoring of PBL –verification and validation of forecasts and models. • Lidar + real time ground monitoring of pollutants: • Characterization of temporal and spatial changes of • particle pollution, oxidants, and precursors.
Acknowledgements Maryland Department of the Environment (U00R6200819) “Measurement of Nocturnal Low Level Jets with UMBC Lidars” NOAA CCNY Foundation CREST (NA06OAR4810162) NASA Cooperative Agreement (NNH04ZYO010C) "Three Dimensional Air Quality System (3D-AQS)” NASA (NNX08AO93G) "Profiling Air Quality over Baltimore” http://alg.umbc.edu/usaq http://alg.umbc.edu/umap *The statements contained within the presentation are not the opinions of the funding agencies or the U.S. government, but reflect the author’s opinions.
CALIPSO April 17, 2010 07:30 UTC Madison, WI http://lidar.ssec.wisc.edu/
CALIPSO April 19, 2010 06:00 UTC Baltimore, MD Hampton, VA
PM2.5 in Baltimore http://www.epa.gov/ttn/airs/airsaqs/detaildata/downloadaqsdata.htm