Download
1 / 46
460 likes | 484 Vues
This presentation offers comprehensive data on asthma in Indiana, covering prevalence, mortality, hospitalization rates, and more. It includes insights on chronic respiratory diseases and statistical significance.

E N D
Asthma In Indiana Amy Brandt, MPH—Chronic Respiratory Disease Epidemiologist Indiana State Department of Health Chronic Respiratory Disease Section January 2014
Description of Presentation This slide set provides a cross-section of data on asthma in Indiana and is intended to be a resource for those working on asthma. If you extract slides from this presentation, please use citations on the slides and reference the Indiana State Department of Health Chronic Respiratory Disease Section. For technical assistance, please contact abrandt@isdh.in.gov. The data presented are the most current for each data source.
Understanding Asthma Data • Prevalence • Annual or average annual number of total cases of asthma. • Mortality • Annual or average annual number of deaths from asthma. • Hospitalization Rates • Age-adjusted rate of hospitalizations with a primary diagnosis of asthma per 10,000 people. • Emergency Department (ED) Rates • Age-adjusted rate of ED visits with a primary diagnosis of asthma per 10,000 people. • Age-adjusted Rates • Removes the impact of different age distributions between populations and allows for direct comparisons of those populations. • Age-specific Rates • Rate in a specific, defined age group. Numerator and denominator refer to the same age group.
Understanding Chronic Respiratory Disease Data—Confidence Intervals and Statistical Significance • Confidence intervals (CIs) are used to describe the range of that variation • Most typically, 95% CIs are calculated, which provide a range of values in which if one repeated a study 100 times, 95 of the intervals would include the true rate. • When 95% CIs do not overlap, the two areas are statistically significantly different at the P<.05 level • i.e., the difference between the two rates is more than that expected by random variation.
Most Common Data Sources • Indiana Behavioral Risk Factor Surveillance System (BRFSS) • www.in.gov/isdh/22860.htm • Centers for Disease Control and Prevention (CDC) BRFSS • www.cdc.gov/brfss • BRFSS Asthma Call-Back Survey (ACBS) • http://www.cdc.gov/brfss/acbs/index.htm • Indiana Hospital Discharge Database • http://www.state.in.us/isdh/20624.htm • Indiana Vital Records • Information: www.in.gov/isdh/23574.htm • Data: www.in.gov/isdh/19096.htm
What is asthma? • Chronic disease of the airways that may cause: • Wheezing • Breathlessness • Chest tightness • Nighttime or early morning coughing • Triggers of asthma episodes can include respiratory infections, allergens, cigarette smoke, air pollution, and exercise. • Episodes are usually associated with widespread, but variable, airflow obstruction within the lung that is often reversible with treatment.
Summary slide for adult asthma • Approximately 1 in 11 (9.1%) Indiana adults (18+ years) are currently diagnosed with asthma. • Adult females in Indiana are more likely than males to have asthma. • An asthma diagnosis is more likely in adults with an annual household income < $15,000 compared to household incomes ≥ $15,000.
Prevalence of asthma among adults (18+ years), Indiana and United States, 2012 Lifetime asthma determined from response to question “…ever told you had asthma?” Current asthma determined from response to question “Do you still have asthma?” Source: CDC and ISDH DAT. (2013). Behavioral Risk Factor Surveillance System Prevalence Data, 2012.
Prevalence of lifetime asthma among adults (18+ years), Indiana, 2000–2010, 2011–2012* *Starting in 2011 prevalence estimates were determined using a new, more precise methodology, including the addition of cell phone respondents and new weighting techniques; therefore, estimates made in 2011 or later should not be compared to earlier prevalence estimates. Source: CDC and ISDH DAT. (2013). Behavioral Risk Factor Surveillance System Prevalence Data, 2000–2012.
Prevalence of lifetime asthma among adults (18+ years) by sex, Indiana, 2000–2010, 2011–2012* *Starting in 2011 prevalence estimates were determined using a new, more precise methodology, including the addition of cell phone respondents and new weighting techniques; therefore, estimates made in 2011 or later should not be compared to earlier prevalence estimates. Source: CDC and ISDH DAT. (2013). Behavioral Risk Factor Surveillance System Prevalence Data, 2000–2012.
Prevalence of current asthma among adults (18+ years), Indiana, 2000–2010, 2011–2012* *Starting in 2011 prevalence estimates were determined using a new, more precise methodology, including the addition of cell phone respondents and new weighting techniques; therefore, estimates made in 2011 or later should not be compared to earlier prevalence estimates. Source: CDC and ISDH DAT. (2013). Behavioral Risk Factor Surveillance System Prevalence Data, 2000–2012.
Prevalence of current asthma among adults (18+ years) by sex, Indiana, 2000–2010, 2011–2012* *Starting in 2011 prevalence estimates were determined using a new, more precise methodology, including the addition of cell phone respondents and new weighting techniques; therefore, estimates made in 2011 or later should not be compared to earlier prevalence estimates. Source: CDC and ISDH DAT. (2013). Behavioral Risk Factor Surveillance System Prevalence Data, 2000–2012.
Prevalence* of current asthma among adults (18+ years) by age group, Indiana, 2012 *Prevalence rates are presented with 95% confidence intervals. Source: CDC and ISDH DAT. (2013). Behavioral Risk Factor Surveillance System Prevalence Data, 2012.
Prevalence* of current asthma among adults (18+ years) by gender, Indiana, 2012 *Prevalence rates are presented with 95% confidence intervals. Source: CDC and ISDH DAT. (2013). Behavioral Risk Factor Surveillance System Prevalence Data, 2012.
Prevalence* of current asthma among adults (18+ years) by race and ethnicity, Indiana, 2012 (NH=Non-Hispanic) *Prevalence rates are presented with 95% confidence intervals. Source: CDC and ISDH DAT. (2013). Behavioral Risk Factor Surveillance System Prevalence Data, 2012.
Prevalence* of current asthma among adults (18+ years) by household income, Indiana, 2012 *Prevalence rates are presented with 95% confidence intervals. Source: CDC and ISDH DAT. (2013). Behavioral Risk Factor Surveillance System Prevalence Data, 2012.
Prevalence* of current asthma among adults (18+ years) by educational attainment, Indiana, 2012 *Prevalence rates are presented with 95% confidence intervals. Source: CDC and ISDH DAT. (2013). Behavioral Risk Factor Surveillance System Prevalence Data, 2012.
Prevalence* of current asthma among adults (18+ years) by sex and age group, Indiana, 2012 *Prevalence rates are presented with 95% confidence intervals. Source: CDC and ISDH DAT. (2013). Behavioral Risk Factor Surveillance System Prevalence Data, 2012.
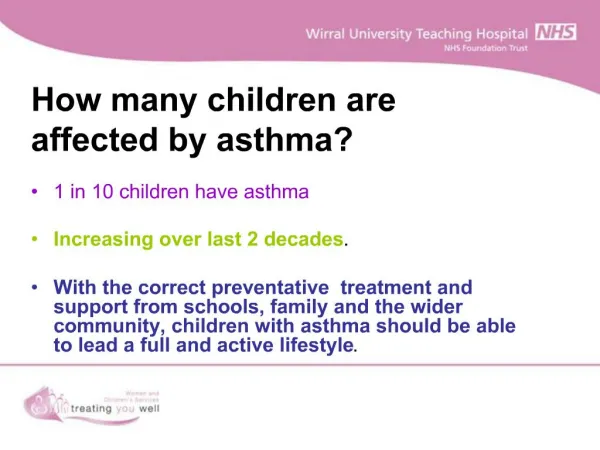
Summary slide for child asthma • Approximately 1 in 10 (9.5%) Indiana children (ages 0-17) are currently diagnosed with asthma. • White children have a significantly lower prevalence rate than black children. • Indiana did not collect child data in 2012. • Asthma prevalence variation over the years can partially be explained by changes in sample size.
Prevalence of asthma among children (0-17 years), Indiana and United States,* 2011 *National estimates are based on the 16 states who collected cell phone and landline data. Lifetime asthma determined from response to question “…ever told you had asthma?” Current asthma determined from response to question “Do you still have asthma?” Source: CDC and ISDH DAT. (2012). Behavioral Risk Factor Surveillance System Prevalence Data, 2011.
Prevalence of lifetime asthma among children (0-17 years), Indiana, 2005–2010, 2011* *The 2011 prevalence estimate was determined using a new, more precise methodology, including the addition of cell phone respondents and new weighting techniques; therefore, the 2011 estimate should not be compared to earlier prevalence estimates. Source: CDC and ISDH DAT. (2011). Behavioral Risk Factor Surveillance System Prevalence Data, 2005-2011.
Prevalence of current asthma among children (0-17 years), Indiana, 2005–2010, 2011* *The 2011 prevalence estimate was determined using a new, more precise methodology, including the addition of cell phone respondents and new weighting techniques; therefore, the 2011 estimate should not be compared to earlier prevalence estimates. Source: CDC and ISDH DAT. (2011). Behavioral Risk Factor Surveillance System Prevalence Data, 2005-2011.
Prevalence*of current asthma among children (0-17 years) by age group, Indiana, 2011 *Prevalence rates are presented with 95% confidence intervals. Source: CDC and ISDH DAT. (2012). Behavioral Risk Factor Surveillance System Prevalence Data, 2011.
Prevalence* of current asthma among children (0-17 years) by sex, Indiana, 2011 *Prevalence rates are presented with 95% confidence intervals. Source: CDC and ISDH DAT. (2012). Behavioral Risk Factor Surveillance System Prevalence Data, 2011.
Prevalence* of current asthma among children (0-17 years) by race and ethnicity, Indiana, 2011 (NH=Non-Hispanic) *Prevalence rates are presented with 95% confidence intervals. Source: CDC and ISDH DAT. (2012). Behavioral Risk Factor Surveillance System Prevalence Data, 2011.
Asthma self-management education among Hoosiers with current asthma 1. CDC and ISDH DAT. (2013). Behavioral Risk Factor Surveillance System Adult Asthma Call-back Survey, 2012. 2. CDC and ISDH DAT. (2012). Behavioral Risk Factor Surveillance System Child Multi-year Asthma Call-back Survey, 2006-2010.
Barriers facing Hoosiers with current asthma 1. CDC and ISDH DAT. (2013). Behavioral Risk Factor Surveillance System Adult Asthma Call-back Survey, 2012. 2. CDC and ISDH DAT. (2012). Behavioral Risk Factor Surveillance System Child Multi-year Asthma Call-back Survey, 2006-2010.
Asthma control among adults (18+ years)*, Indiana, 2011 *Percents are presented with 95% confidence intervals. Source: CDC and ISDH DAT. (2013). Behavioral Risk Factor Surveillance System Adult Asthma Call-back Survey, 2012.
Asthma control among children (0–17 years)*, Indiana, 2006–2010 *Percents are presented with 95% confidence intervals. Source: CDC and ISDH DAT. (2012). Behavioral Risk Factor Surveillance System Child Multi-year Asthma Call-back Survey, 2006-2010.
Asthma* ED visit rates,** Indiana, 2004–2012 *Primary diagnosis asthma emergency department visits. **Age-adjusted rates per 10,000 population. Source: Indiana State Department of Health. (2013). Indiana Hospital Discharge Data Files, 2004-2012.
Asthma* ED visit rates** by age and sex, Indiana, 2012 *Primary diagnosis asthma emergency department visits. **Age-specific rates per 10,000 population. Source: Indiana State Department of Health. (2013). Indiana Hospital Discharge Data Files, 2012.
Asthma* ED visit rates** by month and age, Indiana, 2010–2012 *Primary diagnosis asthma emergency department visits. **Age-specific rates per 10,000 population. Source: Indiana State Department of Health. (2013). Indiana Hospital Discharge Data Files, 2010–2012.
Asthma* hospitalization rates,** Indiana, 2004–2012 *Primary diagnosis asthma hospitalizations. **Age-adjusted rates per 10,000 population. Source: Indiana State Department of Health. (2013). Indiana Hospital Discharge Data Files, 2004-2012.
Asthma* hospitalization rates** by age and sex, Indiana, 2012 *Primary diagnosis asthma hospitalizations. **Age-specific rates per 10,000 population. Source: Indiana State Department of Health. (2013). Indiana Hospital Discharge Data Files, 2012.
Asthma* hospitalization rates** by month and age, Indiana, 2010–2012 *Primary diagnosis asthma hospitalizations. **Age-specific rates per 10,000 population. Source: Indiana State Department of Health. (2013). Indiana Hospital Discharge Data Files, 2010–2012.
Age-adjusted asthma mortality rates*, Indiana, 1999–2011 *Rate per 100,000 population. Source: ISDH Data Analysis Team. Death Reports (Mortality), 1999-2011.
Asthma mortality by age, Indiana, 2006–2011 Source: ISDH Data Analysis Team. Death Reports (Mortality), 2006-2011.
Summary and highlights • In Indiana, 9.1% of adults and 9.5% of children currently have asthma. • Improvements in asthma self-management can help decrease asthma exacerbations such as hospitalizations and ED visits. • A higher priority could be placed on ensuring adults with asthma are getting access to care.
For more information • ISDH Asthma Program website • http://www.in.gov/isdh/24965.htm • Most current Indiana data • http://www.in.gov/isdh/17279.htm • Data request form • http://www.in.gov/isdh/files/Asthma_ISDH_Data_Request_Form.docx • Indiana INdicators: health-related indicators for the state and by county • http://indianaindicators.org/