Download
1 / 22
220 likes | 232 Vues
This project explores exponential modeling to estimate the population of Missoula County in 2015 and 2020, as well as world population in 1990 and 2020. It also examines the significance and aspects of world population portrayed in selected pictures.

E N D
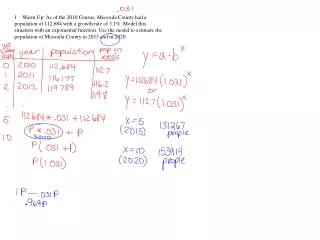
1. Warm Up: As of the 2010 Census, Missoula County had a population of 112,684 with a growth rate of 3.1%. Model this situation with an exponential function. Use the model to estimate the population of Missoula County in 2015 and in 2020.
Use the World Population data on the board to create an exponential regression model on the calculator. Use the model to estimate world population in 1990 (interpolation) and 2020 (extrapolation).
Choose 8 of the 13 pictures and answer the questions: What is the significance of the information portrayed in each picture? What aspect of world population does it address?
1. Warm Up: As of the 2010 Census, Missoula County had a population of 112,684 with a growth rate of 3.1% per year. Model this situation with an exponential function. Use the model to estimate the population of Missoula County in 2015 and in 2020.
Use the World Population data on the board to create an exponential regression model on the calculator. Use the model to estimate world population in 1990 (interpolation) and 2020 (extrapolation).
Choose 8 of the 13 pictures and answer the question: What is the significance of the information portrayed in each picture? What aspect of world population does it address?