Download
1 / 59
590 likes | 610 Vues
This article discusses the mathematical formulations and properties of dynamical systems, specifically focusing on discrete-time models and difference equations. It explores the concepts of linear and nonlinear equations, single-variable and multi-variable models, first-order and higher-order equations, autonomous and non-autonomous systems, and homogeneous and non-homogeneous equations. The simulation of these models using Excel is also demonstrated.

E N D
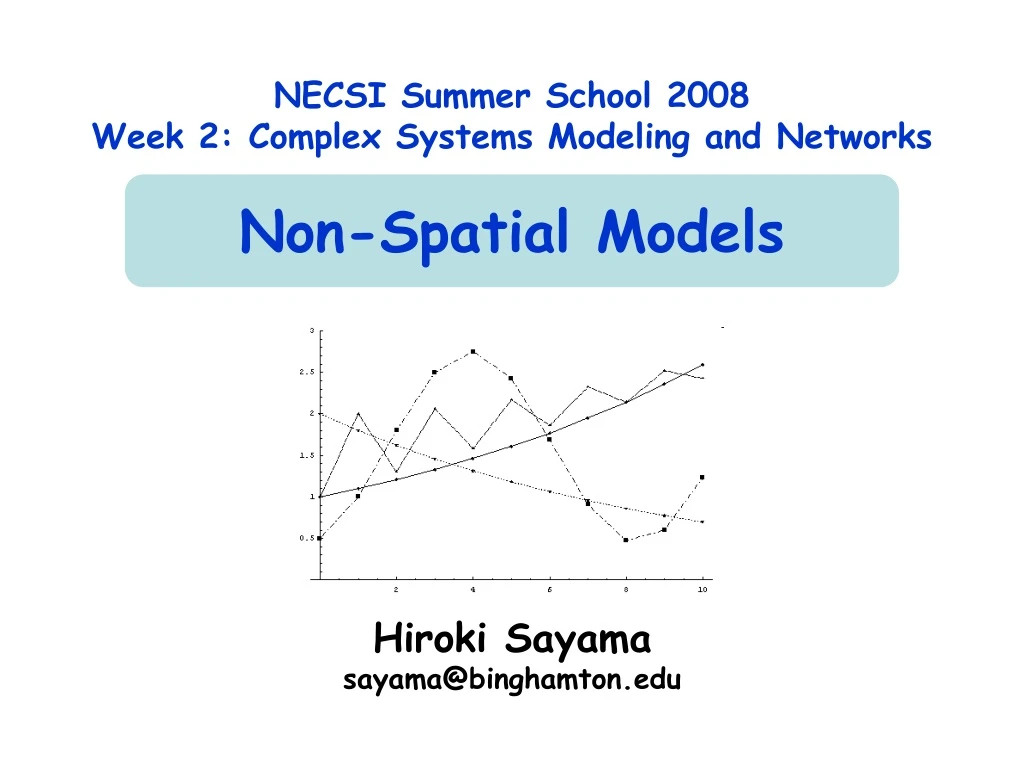
NECSI Summer School 2008Week 2: Complex Systems Modeling and NetworksNon-Spatial Models Hiroki Sayama sayama@binghamton.edu
Dynamical systems approach • A system whose state is uniquely specified by a finite set of variables and whose behavior is uniquely determined by predetermined rules • Simple population growth • Simple pendulum swinging • Motion of celestial bodies • Behavior of two “rational” agents in a negotiation game
Mathematical formulations of dynamical systems • Discrete-time model: xt = F(xt-1, t) • Continuous-time model: (differential equations) dx/dt = F(x, t) xt: State variable of the system at time t • May take “scalar” or “vector” value F: Some function that determines the rule that the system’s behavior will obey (difference/recurrence equations; iterative maps)
Discrete-time model • Easy to understand, develop and simulate • Doesn’t require an expression for the rate of change (derivative) • Can model abrupt changes and/or chaotic dynamics using fewer variables • Directly translatable to stepwise simulation in a computer • Experimentally, we often have samples of system states at specific points of time
Difference equation and time series • Difference equation xt = F(xt-1, t) produces series of values of variable x starting with initial conditionx0: { x0, x1, x2, x3, … } “time series” • A prediction made by the above model (to be compared to experimental data)
Properties of difference equations • A rush of jargons you should know… • Linear vs. nonlinear • Single-variable vs. multi-variable • 1st-order vs. higher-order • Autonomous vs. non-autonomous • Homogeneous vs. non-homogeneous
Linear vs. nonlinear • Linear: • Right hand side is just a first-order polynomial of variables xt = a xt-1 + b xt-2 + c xt-3 … • Nonlinear: • Anything else xt = a xt-1 + b xt-22 + c xt-1 xt-3 …
Single-variable vs. multi-variable • Single-variable (univariate): • Just one equation given for a series {xt} xt = a xt-1 + b xt-22 + c / xt-3 … • Multi-variable (multivariate): • Multiple equations given to simultaneously describe multiple series {xt}, {yt}, … xt = a xt-1 + b yt-1 yt = c xt-1 + d yt-1
1st-order vs. higher-order • 1st-order: • Right hand side refers only to the immediate past xt = a xt-1 ( 1 – xt-1 ) • Higher-order: • Anything else xt = a xt-1 + b xt-2 + c xt-3 … (Note: this is different from the order of terms in polynomials)
Autonomous vs. non-autonomous • Autonomous: • Right hand side includes only state variables (x) and not t itself xt = a xt-1 xt-2 + b xt-32 • Non-autonomous: • Right hand side includes terms that explicitly depend on the value of t xt = a xt-1 xt-2 + b xt-32 + sin(t)
Homogeneous vs. non-homogeneous • Homogeneous: • Every term in the right hand side has the same order xt = a xt-1 + b xt-2 + c xt-3 • Non-homogeneous: • Anything else (typically has constants) xt = a xt-1 + b xt-2 + c xt-3 + d
Exercise { Linear / nonlinear }? { Single-variable / multi-variable }? { 1st-order / higher-order }? { Autonomous / non-autonomous }? { Homogeneous / non-homogeneous }? (1) xt = a xt-1 + b xt-2 + c xt-3 … (2) xt = a xt-1 + b xt-22 + c xt-1 xt-3 … (3) xt = a xt-1 + b xt-22 + c / xt-3 … xt = a xt-1 + b yt-1 yt = c xt-1 + d yt-1 (5) xt = a xt-1 ( 1 – xt-1 ) (6) xt = a xt-1 xt-2 + b xt-32 (7) xt = a xt-1 xt-2 + b xt-32 + sin(t) (8) xt = a xt-1 + b xt-2 + c xt-3 + d (4)
Things that you should know (1) • Non-autonomous, higher-order equations can always be converted into autonomous, 1st-order equations • xt-2→ yt-1, yt = xt-1 • t → yt, yt = yt-1 + 1, y0 = 0 • Autonomous 1st-order equations can cover dynamics of any non-autonomous higher-order equations too!
Exercise • Convert each of the following equations into autonomous, 1st-order form: xt = xt-1 + xt-2 xt = xt-1 + xt-2 sin(t)
Things that you should know (2) • Linear equations • are analytically solvable • show either equilibrium, exponential growth/decay, periodic oscillation (with >1 variables), or their combination • Nonlinear equations • may show more complex behaviors • do not have analytical solutions in general
Simulation in Excel • Simulation of a discrete-time model can be implemented easily by writing difference equations in each cell • Time flows from top to bottom • N-dimensional system can be implemented using N columns; each column represents time series of one variable • Visualization is also easy
Exercise • Implement the following models in Excel and produce time series for t = 1~10 xt = 2 xt-1 + 1, x0 = 1 xt = xt-12 + 1, x0 = 1
Exercise • Simulate the following set of equations in Excel and see what happens if the coefficients are varied xt = 0.5 xt-1 + 1 yt-1 yt = -0.5 xt-1 + 1 yt-1 x0 = 1, y0 = 1
Introducing nonlinearity to growth • Simple exponential growth model: xt = a xt-1 • Problem: How can one implement the saturation of growth in this model? • Think about a new nonlinear model: xt = f(xt-1) xt-1 • Coefficient replaced by a function of x
Modeling saturation of growth xt = f(xt-1) xt-1 • f(x) should approach 1 (no net growth) when x goes to a carrying capacity of the environment, say K • f(x) should approach the original growth rate a when x is very small (i.e., with no saturation effect)
a – 1 f(x) = – x + a K What should f(x) be? f(x) a 1 x 0 K
Net growth A new model of growth xt = f(xt-1) xt-1 = ( – (a – 1) xt-1 / K + a ) xt-1 • Using r = a – 1: xt = ( – r xt-1 / K + r + 1 ) xt-1 = xt-1 + r xt-1 ( 1 – xt-1 / K )
Nonlinear terms Logistic growth model • N: Population • r: Population growth rate • K: Carrying capacity • Discrete-time version: Nt = Nt-1+ r Nt-1 ( 1 – Nt-1/K ) • Continuous-time version: dN/dt = r N ( 1 – N/K )
Exercise • Simulate the behavior of the logistic growth model using Excel with 0 < r < 3, K = 1, N0 = 0.01 • Consider if the same behavior can be achieved by a linear model • If not, how is it different?
Logistic map • *The* most famous single-variable nonlinear difference equation xt = a xt-1 ( 1 – xt-1 ) • Similar to (but not quite the same as) the discrete-time logistic growth model (missing first xt on the right hand side) • Shows quite complex dynamics as control parameter a is varied
Exercise: Equivalence between logistic growth and logistic map Nt = Nt-1+ r Nt-1 ( 1 – Nt-1/K ) • This becomes equivalent to the logistic map if we assume: Nt = xt K (1 + r) / r • Show that this is correct • Determine the relationship between growth rate r in logistic growth models and coefficient a in logistic maps
What is going on for a > 3? • Example: a = 3.2 • Period-doubling bifurcation • System starts to oscillate with a doubled period
What is going on for a > 3.57? • Example: a = 3.8 • Chaos • The system loses periodicity after a cascade of period doubling events
Discovery of chaos • Discovered in early 1960’s by Edward N. Lorenz (in a 3-D continuous-time model) • Popularized in 1976 by Sir Robert M. May as an example of complex dynamics caused by simple rules (he used a 1-D discrete-time logistic map)
Chaos in dynamical systems • A long-term behavior of a dynamical system that never falls in any static or periodic trajectories • Looks like a random fluctuation, but still occurs in completely deterministic simple systems • Exhibits sensitivity to initial conditions • Can be found everywhere
Take-home lessons • Complexity does NOT require complex underlying rule structure • Simple deterministic systems may show complex behavior if they are nonlinear • Nonlinear systems often entail chaos in their dynamics • This is why analytical solutions are not available for nonlinear systems
Modeling with multiple variables • Problem: Develop a nonlinear model of a simple ecosystem made of predator and prey populations
Remember: Creating a model of complex systems • Define the key questions and choose the right scale of modeling • Identify structure (parts and their connections) of the system • Define possible states for each part • Describe how the state of each part changes over time through interactions with other parts
Think about at which scale you want to develop a model Rabbit Population : x Fox Population : y
+ - Naturally grows to carrying capacity if isolated Naturally decays if isolated Think about how variables behave in isolation Rabbit Population : x Fox Population : y
Initial assumptions • Rabbits will grow based on the logistic growth model, with carrying capacity = 1 for simplicity • Foxes will decay exponentially Rabbit: xt = xt-1 + a xt-1 (1 – xt-1) Fox: yt = b yt-1 (0<a, 0<b<1)
Positive influence Foxes’ growth rate increases with increasing rabbits + - Negative influence Rabbits’ survival rate decreases with increasing foxes Think about how variables interact with each other Rabbit Population : x Fox Population : y + - Naturally grows to carrying capacity if isolated Naturally decays if isolated
Revised model • Introduced coefficient (1 – c yt-1) (0<c) to the first term of x • Negative influence of foxes on rabbits’ survival rate • Replaced b with (b + d xt-1) (0<d) • Positive influence of rabbits on foxes’ growth rate Rabbit: xt = (1 – c yt-1) xt-1 + a xt-1 (1 - xt-1) Fox: yt = (b + d xt-1) yt-1 (0<a, 0<b<1, 0<c, 0<d)
Exercise Rabbit: xt = (1 – c yt-1) xt-1 + a xt-1 (1 - xt-1) Fox: yt = (b + d xt-1) yt-1 • Simulate the behavior of this model in Excel • Try using several different values for a, b, c, and d, to see what kind of dynamics are possible
FYI: Lotka-Volterra model • This model can be rewritten as: xt – xt-1 = a xt-1 (1-xt-1) – b xt-1 yt-1 yt – yt-1 = - g yt-1 + d xt-1 yt-1 • Known as the “Lotka-Volterra” equations (of discrete-time version with carrying capacity) • Models predator-prey dynamics in a general form • One of the most famous nonlinear systems with multiple variables
Mathematical formulations of dynamical systems • Discrete-time model: xt = F(xt-1, t) • Continuous-time model: (differential equations) dx/dt = F(x, t) xt: State variable of the system at time t • May take “scalar” or “vector” value F: Some function that determines the rule that the system’s behavior will obey (difference/recurrence equations; iterative maps)
A general form (first-order, autonomous) dx1/dt = F1 (x1, x2, x3, …) dx2/dt = F2 (x1, x2, x3, …) dx3/dt = F3 (x1, x2, x3, …) … or dx/dt = F(x) where x is a state vector of the system (x = {x1, x2, x3, …} )
Higher-order/non-autonomous systems • Higher-order systems: Differential equations that include second-order (or higher) derivatives • Non-autonomous systems: Differential equations that are time-dependent (i.e., explicitly include t in them)
The following argument also holds for differential equations • Non-autonomous, higher-order equations can always be converted into autonomous, 1st-order equations • d2x/dt2→ dy/dt, y= dx/dt • t → y, dy/dt= 1, y0 = 0 • Autonomous 1st-order equations can cover dynamics of any non-autonomous higher-order equations too!
Exercise • A simple pendulum: d2q/dt2 = - g/L sin q • Convert this into a first-order form