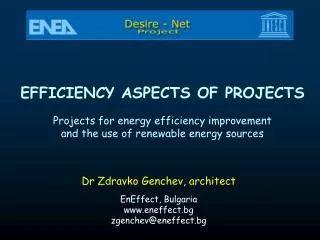
EFFICIENCY ASPECTS OF PROJECTS
430 likes | 456 Vues
Discuss the efficiency of projects related to energy improvement and renewables, project baseline influence, strategies, and examples of implementation. Explore socially, technically, environmentally, and economically effective projects.

EFFICIENCY ASPECTS OF PROJECTS
E N D
Presentation Transcript
EFFICIENCY ASPECTS OF PROJECTS Projects for energy efficiency improvement and the use of renewable energy sources Dr Zdravko Genchev, architect EnEffect, Bulgaria www.eneffect.bg zgenchev@eneffect.bg
AIM OF THIS LECTURE To discuss: DEFINITIONS of the efficiency of projects, related to improvement of energy efficiency and the use of renewable energy sources PROJECT BASELINEinfluence on the efficiency of EE / RES projects STRATEGIES / EXAMPLES for project implementation under various circumstances
EFFICIENTare projects that lead to positive results DEFINITIONS Depending on the types of results achieved we recognize various types of PROJECT EFFICIENCY: Social impact / Technical improvementsEnvironmental impact / Cost-effectiveness or combinations of the above
DEFINITIONS SOCIALLY EFFECTIVE are projects that produce social impact: • Improvement of the general quality of services provided • Improvement of hygienic conditions in buildings • Assistance for the most vulnerable strata of the low-income inhabitants to cover increasing energy bills • Achievement of high aesthetical standards, etc.
DEFINITIONS SOCIALLY EFFECTIVE projects that include EE measures and especially the use of RES sometimes introduce unusual aesthetical solutions that are often debated This might be the result of: • Poor experience and inability to integrate new technical solutions into already established aesthetical concepts and values • Attempt to introduce new aesthetival principles that are still unusual for society and thus difficult to accept
DEFINITIONS TECHNICALLY EFFECTIVE are projects that achieve technical improvements of buildings, which generate energy savingsand/or decrease O&M costs: • General improvement of the building structure and building envelope • Improvement of the technical infrastructure (various types of installations) of buildings • Improvement of the technical equipment of buildings, incl. various types of appliances in use
DEFINITIONS ENVIRONMENTALLY EFFECTIVE are projects that have positiveenvironmental impact: • Reduction of GHG emissions that have global effect on the environment • Reduction of emissions that cause local pollution or other threat to the environment
DEFINITIONS ECONOMICALLY EFFECTIVE are projects that have positive economic impact (cost-effective projects): • Reduce energy expenses and O&M costs, thus generating real monetary savings • Significantly improve the service/comfort at comparable expenses
When determining the achieved project results,we usually compare the situation after project implementation with the overall status before the project PROJECT BASELINE The status before project implementation we call INITIAL STATUS The initial status is a fixed picture of the situation before project implementation
PROJECT BASELINE The overall status before project implementation, which we use to compare with the situation after project implementation, is notjust a picture of the state-of-affairs at a given point of time It is a dynamic description of the development of the initial status (before project implementation) for the time of the entire project duration in case no project was implemented We call this descriptionPROJECT BASELINE SCENARIO
PROJECT BASELINE Baseline scenario The baseline consists of: Initial status and Baseline scenario Energy Initial status 2006 2007 2008 2009 Time Expected development of the initial statuswithout project
PROJECT BASELINE The Project Baseline Scenario presents how the initial status would be changed in case of keeping BUSINESS AS USUAL The difference between the Project Baseline Scenario and the overall situation after project implementation presents project results and the level of its effectiveness
PROJECT BASELINE Baseline scenario Saved energy Energy Energy Initial status Initial status 2006 2007 2008 2009 Time 2006 2007 2008 2009 Time Expected energy savings Expected developmentof initial status
PROJECT BASELINE Energy Development of initial status (baseline scenario) Initial status Energy consumption after project implementation 2007 2008 2009 2006 Time
PROJECT BASELINE Measurable and non-measurable indicatorscould be used for evaluation of the Project Baseline and the overall situation after project implementation Although we often use only economic indicators to describe the Prolect Baseline and the situation after project implementation, the full descriptions consist of social / technical / environmental / economic characteristics
When forecasting the baseline development we may use: OPTIMISTIC (high) or PESSIMISTIC (low) or REALISTIC (medium) Baseline Scenario PROJECT BASELINE
PROJECT BASELINE High Development from initial status Energy Medium Initial status Low 2007 2008 2009 2006 Time
The most important component of the initial status and the baseline scenario is energy consumption Calculated energy consumptionis the amount of energy, which would be consumed by the total installed energy capacity for provision of heating and lighting in compliance with the normsand the typical use of the building Measured energy consumptionis the amount of energy, which has been proven by measuring the actual consumption of heat and electricity, regardless of the quality of the services provided PROJECT BASELINE
Calculated energy consumption may correspond to the measured one, but in some cases it might also be higher or lower When the calculated energy consumption is LOWER than the measured one, it might be the result of water leakage in the heating system, too high indoor temperatures, insufficient wall insulation, poor maintenance, etc. PROJECT BASELINE
PROJECT BASELINE Typical reason for lower calculated energy consumption in a school building (example of Macedonia)
When the measured energy consumption is higher then the calculated one, there is room for energy efficiency improvements This is the usual case in most buildings that need energy efficiency improvement The bigger the differences, the higher the potential for energy efficiency improvements PROJECT BASELINE
PROJECT BASELINE Energy consumption A Measured energy consumption C Calculated energy consumption Time 2007 2008 2009 2006
When the calculated energy consumption is HIGHER than the measured one, it might be an indication that some of the technical systems are turned off (e.g. the ventilation system), the indoor temperature is too low or the lighting is not sufficient, etc. In such cases we usually qualify the baseline as TOO LOW, which affects negatively the economic characteristics (cost-effectiveness) of EE / RES projects PROJECT BASELINE
PROJECT BASELINE Energy consumption A Calculated energy consumption C Measured energy consumption Time 2007 2008 2009 2006
Possible reasons for TOO LOW baseline: The building owner has turned off or reduced the operation period or the capacity of some in-house subsystems The heating system has been turned off in some sections of the building during the heating season There has been breakdown in some in-house subsystems, which have not been repaired or replaced The automatic control system and valves are not correctly tuned, so the room temperature is too low Some hygienic requirements have not been achieved (low temperature, insufficient lighting etc.) PROJECT BASELINE
In cases of low baseline we may adjust (normalize) the baseline to the level of the calculated one THE ADJUSTED BASELINE is useful when calculating the project’s economic characteristics and determining the project’s efficiency The use of adjusted baseline improves the economic characteristics of projects PROJECT BASELINE
PROJECT BASELINE Calculated (adjusted) baseline scenario Energy consumption A A. Calculated energy consumption before project implementation Calculated energy consumption B B.Calculated energy consumption after project implementation C Measured energy consumption Measured (real)baseline scenario C. Measured energy consumption before project implementation D D. Measured energy consumption after project implementation Time 2007 2008 2009 2006
Real and adjusted baseline could be used in different practical cases REAL (CALCULATED) BASELINE is usually applicable for commercially financed projects (commercial banks, revolving funds, etc.) ADJUSTED (CALCULATED) BASELINE is usually applicable for projects, financed on a grant basis or when parties explicitly agree upon that STRATEGIES / EXAMPLES
When the real baseline is lower than the calculated one, the use of adjusted baseline improves the economic characteristics of EE / RES projects The following practical examples show different strategies (approaches) in determining the baseline scenarios to be used in each specific case STRATEGIES / EXAMPLES
Calculated consumption according to the installed capacity (adjusted) 6535 According to the installed capacity 1617 Possible policy target STRATEGIES / EXAMPLES Energy Street lighting project in the city of Gabrovo, Bulgaria Real (measured) consumption 2463 620 The same level of utilization Time After Before
Before ESPC During ESPC After ESPC Savings ESCO & Financial Debt service Savings Cash flow ($) Energy + O&M Energy + O&M Energy + O&M STRATEGIES / EXAMPLES Energy + O&M Cost Savings Source: Satish Kumar, PhD, scientist, LBNL, USA, Technical coordinator of PIMVP Reflection of baseline scenarios in cases of energy saving performance contacts (ESPC)
STRATEGIES / EXAMPLES SCHOOLS IN MOLDOVA Telecommunication College Before project implementation the amount of heat received was significantly below the necessary quantity Main benefits after project implementation: - Improvement of the heat distribution inside the building - Improved in-door comfort and reduced sickness rates Almost no energy savings registered Source: ASE, Moldova
STRATEGIES / EXAMPLES • SCHOOLS IN MOLDOVA • School 95 • Before project implementation the school received more heat than necessary • Main benefits after project implementation: • - Reduced heat consumption to about 50% for a standard year by the application of night setback algorithm • Improved heat distribution inside the building and in-door comfort • Significant energy savings Source: ASE, Moldova
STRATEGIES / EXAMPLES • SCHOOLS IN MOLDOVA • School 83 • Before project implementation the school received heat close to the necessary • Expected benefits: • Even heat distribution inside the building • Constant in-door comfort • Easier maintenance of the heating system • In this particular case the savings have a greater level of confidence than in the previous two cases Source: ASE, Moldova
STRATEGIES / EXAMPLES SCHOOL BUILDING PROJECT IN KIEV (WB) The baseline much below the norms. The WB advised to use the adjusted baseline that corresponds to the norm As a result: Calculated savings of 26% Sufficient real savings to repay the ~$20M loan from the WB over a 5-year term The project is looked upon as a model to implement in other Ukrainian cities Source: Battelle, USA
STRATEGIES / EXAMPLES • BUILDING IN BULGARIA • Education complex in Kazanlak • Low baseline – average in-door temperature about 10o C • Used adjusted baseline that corresponds to the norm • As a result: • (for various sets of ES measures) • Calculated savings of 35-57% • IRR: 13 – 48 % / Simple payback: 2,3 – 5,8 years • Improved in-door climate • Reduced GHG emissions Source: EnEffect
STRATEGIES / EXAMPLES • BUILDING IN BULGARIA • Kindergarten in Gradina • Low baseline – part of premises not heated • Used adjusted baseline that corresponds to the norm • As a result: • Significant energy savings expected • Insufficient real financial savings due to the low baseline • Improved in-door climate • Reduced GHG emissions Source: EnEffect
STRATEGIES / EXAMPLES SOME OTHER LESSONS LEARNED Cream skimming From the standpoint of private cost-bearing, using strictly commercial finance, cream skimming projects are viable, however those with a longer-payback/lower-ROI (return on investment) might become marginal Source: Battelle, USA
STRATEGIES / EXAMPLES SOME OTHER LESSONS LEARNED Social impact If the entire social cost is included (subsidies - direct to consumers and indirect ones on fuels), the loan can be easily repaid over a short term. The problem here has always been how to mobilize the myriad of state and local government organizations to recognize this factor - if that could be done, repaying these loans would be easy as a snap. Source: Battelle, USA
APPRECIATIONS This lecture was prepared with the kind assistance of: Experts from the Center for Energy Efficiency EnEffect (Bulgaria), ENSI International (Norway) and Battelle / PNNL (Pacific Northwest National Laboratories), USA Experts from Bosnia and Herzegovina, Moldova, and Macedonia Publications of scientists of the LBNL (Lawrence Berekley National Laboratory) and the ASE (Alliance to Save Energy) of USA are also quoted