Download
1 / 37
370 likes | 377 Vues
Hindusthan National Glass & Industries Ltd. (HNGIL). CORPORATE PRESENTATION. July, 2010. Disclaimer.

E N D
Hindusthan National Glass & Industries Ltd. (HNGIL) CORPORATE PRESENTATION July, 2010
Disclaimer The Corporate Presentation (the “Presentation”) is based on management estimates and is being provided to you (herein referred to as the “Recipient”) only for information purposes. The sole purpose of this Presentation is to provide preliminary information on the business activities of the Company, in order to assist the recipient in understanding the Company. This Presentation does not purport to be all inclusive or necessarily include all information that a prospective investor may desire in evaluating the Company. The Company expressly disclaims any and all liability for any errors and/or omissions, representations or warranties, expressed or implied as contained in this document. This Presentation contains certain forward looking statements which are based on certain assumptions of future events over which the Company exercises no control. Hence this involves number of risks and uncertainties which could cause the actual results to differ materially from those that may be projected or implied by these forward looking statements. Such risks and uncertainties include, but are not limited to: our ability to manage growth, competition, attracting and retaining skilled professionals, time and cost overruns, regulatory approvals, market risks, domestic and international economic conditions, changes in laws governing the Company including the tax regimes and exchange control regulations. The Company does not undertake to update any forward looking statements that may be made from time to time by or on behalf of the Company. This Presentation may not be photocopied, reproduced or distributed to others at any time without prior consent of the Company. Upon request, the Recipient will promptly return all material received from the Company without retaining any copies thereof. In furnishing this Presentation, the Company do not make any obligation to provide the Recipient with access to any additional information on the Company or its subsidiaries. This Presentation should not be deemed an indication of the state of affairs of the company nor shall it constitute an indication that there has been no change in the business or state of affairs of the Company since the date of publication of this Presentation. Any clarifications / queries as well as any future communication regarding the Company should be addressed to the Company. “This presentation does not constitute a prospectus, offering circular or offering memorandum or an offer, invitation, or a solicitation of any offer, to purchase or sell or subscribe, any shares of the Company and should not be considered or construed in any manner whatsoever as a recommendation that any person should subscribe for or purchase any of the Company’s shares.”
PRESENTATION OUTLINE Presentation Outline • HNGIL Background • About HNGIL • Inorganic Growth, Growth story, Pan-India Presence • Board of Directors • In – house group synergies • Shareholding Pattern • Product offerings, Industry and Customer Outlook • Expansion plans • Expanding EBIDTA Margins • Financial Highlights • Financial Projections • HNGIL’s ratings & rankings • HNGIL – Strategic Moves
About HNGIL • Deep roots in Glass Industry for over 60 years. • Growth from a small furnace of 30 TPD in 1952 to over 2800 TPD currently. Present capacity over one million tonnes per annum. • Continuous up gradation of technology by re-deployment of internal accruals ensuring continually improved quality parameters. • Market leaders (65% appx.) in Indian Glass Container Market. • Strong Financials. • Backward integration by way of having 100% Subsidiary – Glass Equipment (India) Ltd., manufacturing Glass Bottle making equipments and spares. HNGIL also has its own foundry, Mould shop and Bottle printing division, giving substantial cost benefits.
About HNGIL • Due to capital intensive nature of the industry, high entry barriers to new entrants. • HNGIL’s Gross Fixed Assets in excess of Rs 16 bn as at 31st March,2010 • Consolidation through acquisitions over last 8 years has helped improve margins. • Strong sustained relationship with customers and suppliers. • Operating efficiencies and Quality comparable with the world standards. • Vast managerial pool • Phenomenal Growth in Revenue & Margins over the years (FY 2007 to 2010) - Sales CAGR at 25% and PAT CAGR at 280%.
Pioneering Vision “To create a world-class glass manufacturing plant that pursues Quality, Cost Reduction, and Productivity Improvement measures in a truly holistic manner, leading to Customers’, Shareholders’, Employees’ and Suppliers’ Satisfaction; this integrated effort will result in the Company becoming an Industry Benchmark and a role model for systems, processes and results.”
INORGANIC GROWTH • During last 9 years, HNGIL has made following 3 acquisitions of loss making or sick and closed Companies/ industrial undertakings and successfully turned them around within a short span of time :- • January 2002 – Acquired Owens Brockway India Ltd. - having Plants at Puducherry and Rishikesh with a capacity of 700 TPD. Name of the company was changed to Ace Glass Containers Ltd.. • October 2005 – Acquired loss making Unit of L&T Nashik, having a capacity of 350 TPD. • October 2007 – Acquired the Assets of Haryana Sheet Glass’s Neemrana Unit, revamped the plant and started commercial production in record time – by March 2008 The Journey continues …………., there are several exciting business opportunities both in India and abroad as of today. • Today, all these acquired units contribute to wealth creation for the Company and its stakeholders
Growth – Organic & Inorganic Expanded 2825 TPD Acquisition of Assets of Neemrana Plant – Capacity 2585 TPD Together constituted Ace Glass Containers Capacity at 2435 TPD L&T plant acquisition – Capacity at 2150 TPD Capacity at 1800 TPD post Owens’ acquisition Growth Expanded Capacity to 1100 TPD Installed Capacity of 30 TPD Present 1952 2000-01 2001-02 2005-06 2006-07 2007-08
Pan – India presence Delhi Kolkata Mumbai Hyderabad Bengaluru Chennai Plant Locations Marketing Office
Board of Directors Mr. Chandra Kumar Somany, Chairman Mr. Sanjay Somany, Managing Director Mr. Mukul Somany, Joint Managing Director DIRECTORS ▪ Mr. Kishore Bhimani ▪ Mr. Sujit Bhattacharya ▪ Mr. Ratna Kumar Daga ▪ Mr. Dipankar Chatterji ▪ Mr. Shree Kumar Bangur ▪ Dr. Indrajit Kr. Saha ▪ Mr. Ram Raj Soni
In-House Group Synergies • Glass Equipment (India) Ltd. • A 100% subsidiary of HNGIL located at Bahadurgarh, produces world class Equipments and Spares for production and handling of Glass Bottles at much lower cost and meets bulk of the requirements of HNGIL. • HNG Float Glass Ltd. • Greenfield Float Glass Plant set up at Halol, Gujarat at a cost of Rs 600 crores (Debt Rs. 350 crores and Equity Rs. 250 crores), has commenced production in a record time of 21 months and products manufactured by the company have been very well received in the market. Within a short span of 3 months, the plant has achieved Global benchmarks in production efficiency. Contemplating setting up a second Float line (1050 TPD) in the same location. • Also capable of manufacturing Glass to meet the needs of Auto sector. • Also Planning a wider range to meet the Market demand for value added products. HNG FLOAT
Shareholding Pattern • *Includes 16.76% held as treasury shares in the Company • Note: Total shares 873.39 lacs of face value Rs. 2 each, fully paid up
Wide variety of products • HNGIL Produces more than 15 million bottles per day • Ranging from 5 ml to 3200 ml • High quality – ISO 9001/2000 • Multifarious industries: • Liquor & Beer • Pharmaceuticals • Beverages • Processed Foods • Cosmetics etc. • Our Competitors in India – Piramal Glass, Hindusthan Sanitaryware, Vitrum Glass, Haldyn Glass
Revenue Mix Segment-wise Color-wise Region-wise
Liquor • Indian IMFL market is pegged at around Rs.200 bn (US $4.5 bn) • In terms of volumes, 236 million cases • CAGR of 15% over last 5 years, expected to grow at least at the • same rate • Market Growth rate of 12-13% per annum Growth Drivers of the Liquor Industry: • Low per capita consumption: India 1.83 liters, whereas global average is 3.1 liters • Demographics is going to change from 48% (2001) to 54% in 2011 comprising of youth and middle aged population. • In Indian demographics, nearly 485m people are at the drinking age and another 100m is likely to be added over the next 5 years. • Increasing deregulation by state governments. • Cultural change is adding consumption. Considering HNGIL’s market share of 60%, total glass market supply is pegged at 95 million cases. Thus, HNGIL has huge potential to capture re-used bottles market
Beer • In terms of volumes, 191 million cases or 14.9 hectoliters • Double digit growth rate of 14-15% • CAGR over last 3 years has been around 18-20% Growth Drivers of the Beer Industry: • Lowest per capita consumption: India 1.3 liters, whereas global average is 24 liters • India has predominantly a warm/hot climate • The beer-drinkers in the country are much younger than the average beer-drinkers elsewhere in the world. • Increasing exposure to beer and wine drinking, mainly due to media and consumer mobility. Considering HNGIL’s market share of 75%, total glass market supply is pegged at 28 million cases only.
Food • The Indian food market is estimated to total about Rs. 8,400 bln. according to the ‘Indian Food Report 2008’ published by Research and Markets. • Processed food market is pegged at Rs. 3,200 bln or US $70 billions • Industry has grown at 13.7% in only 4 years and is expected to grow at a rate of 10% in next 5 years • Growth Drivers of the Food Industry: • Increasing health consciousness - with a move away from traditional unpackaged formats to packaged, branded goods • Changes in lifestyles of urban and rural middle class • More women are entering the workplace, leaving less time for them to prepare traditional home-made foods • Increased salary levels of the huge middle income group providing higher levels of disposable income
Soft Drinks • The Indian soft drink market is worth about Rs. 60 bln per annum. • Indian soft drink market is growing @7- 8% per annum • Growth Drivers of the Soft Drinks Industry: • The per capita consumption of soft drinks: - India’s consumption amongst the lowest in the world – 5 bottles per annum. • Humid climate conditions
Pharmaceuticals • India's pharmaceutical industry is now the third largest in the world in terms of volume and 14th in terms of value. The Indian pharmaceutical market is likely to touch US$ 50 billion by 2020 • Indian market now is worth around Rs. 570 bln or US $12.3 billion • The industry is typically growing at around 1.5-1.6 times the country's gross domestic product (GDP) growth. • Industry is growing with CAGR of 12-15% as against a global average of 4-7% during 2008-2013 (as per IMS) • Growth Drivers of the Pharma Industry: • The Indian middle class, with its increasing purchasing potential, is expected to become a major buyer segment. • Expansion of healthcare facilities in the rural and far-flung areas has enhanced accessibility. • Increasing penetration of customized insurance plans would drive affordability, influencing the consumption of medical and healthcare products. • The rise in chronic diseases Glass Bottle market has experienced a de-growth of 5% CAGR due to penetration of PET Bottles
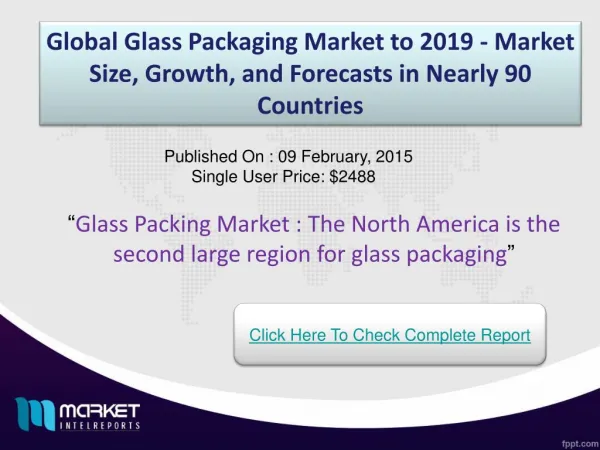
Global Packaging Scenario • The consumer market dominates the global packaging industry. It accounts for an estimated 70% of sales, with industrial applications taking the remaining 30% share. • Average annual growth rate of global packaging industry is around 3.5% and the value is expected to reach US $ 597 billion by 2014. • Long-term growth in global packaging can be found in emerging markets and developing countries of Asia-pacific, Middle East, Central and Eastern Europe. • There is a strong correlation between general economic development and packaging. General economic growth (which typically correlates well with packaging growth) over the past 10 years have been on average as follows -- • World:3-4 %Europe:2-3 %Asia:6-7 % • The economic growth figures points at a strong packaging market in large parts of Asia.
Indian Packaging Scenario • The market volume of the Indian packaging industry amounts to about Rs. 77,570 crores (US $16.7 billion) and has constantly grown by approximately 15 percent year on year. • The pace of growth will accelerate to between 20 percent over the next five years. • The present share of about 6-7% of Glass Packaging in the total Indian Packaging industry offers huge opportunities on account of health, hygiene and environment • India constitutes a mere 3% of global packaging Industry, while population constitutes 16% of global. • The large growing middle class, liberalization and organized retail sector are the catalysts to growth in packaging. • Indian companies are now placing increasing emphasis on attractive and hygienic packaging. This promises enormous potential for Glass container Industry in the future.
Trends in Glass Packaging Industry in India • Industry growth rate has been around 7 to 8 % per annum • The growth of organized retail has acted as catalyst for glass • packaging industry • Industry has succeeded in making light weight glass bottles, glass bottles of fancy shapes, frosted finish, etc. • Spirits & Beer has been fastest growing segment in terms of glass consumption • Exports of food applications have also been a growing • segment of late, as plastic packaging is coming under • environmental related sensitivities in several advanced • market. • Organized retail boom. • Increase in disposable income and customer aspiration. • Increase in middle class population. • Increase in working women population. • Rapid urbanization.
Ramp-up in capacity • HNGIL has planned a capital expenditure of Rs. 896 Crores to further increase production capacity and rebuilds within next two years. • Greenfield plant in AP : at 490 Crs. (650TPD) • (Land has been already allotted to HNGIL , Project commencement date expected is July’10 and targeted project completion date is Mar’12) • New Furnace in Nashik : 115 Crs. ( 100 TPD) • Maintenance Capex : 300 Crs. ( 120 TPD) • HNGIL is also looking for further acquisitions in this space, both nationally and internationally and would be guided by the “ value buy” proposition, as in the past. • Note : HNGIL capacity is planned to reach 3700 TPD in next 2 years from present 2825 TPD
Key Reasons for Improving Margins • Switchover to natural gas in manufacturing process, by replacing Furnace Oil and LPG across all 6 plants. • World class designing and mould manufacturing facility in the Company, with own Foundry. JV formed with OMCO, which will further improvise on this head. • Economies of scale in procurement of Raw Materials/Consumables • Light weighting, while producing stronger bottles – Mutual benefit to customers and HNGIL • HNGIL introduced NNPB (Narrow neck press & blow technology) for the first time in India, HNGIL is exploring further strengthening of this technology.
Key Reasons for Improving Margins • Shrink film required for packaging is manufactured by ourselves. This part is continuously increasing for the share of captive. • Sand Mining – Bankura, Sand benefication plant for Rishra unit, exploring opportunities for other plants as well. Assurance of long term supplies, economy and better quality • Further increase in our own fleet of transportation – ensuring both economy and in time delivery. • Waste heat recovery projects already initiated. • Further rationalization of unskilled manpower through automation. • EBITDA margin should be in the range of 28 to 30% on above measures implementation.
Financial Performance – P&L All values in Rs. million $dip in EBIDTA margin was due to unprecedented global crude prices and whereas only a partial passing of costs to customers was done and that too, with a time-lag. **Reasons for dip in PAT amount was, apart from Power cost as above, Forex derivative and other translation loss, otherwise PAT margin was 11 %. Recessionary economic conditions prevailed in FY09.
Financial Performance – Balance Sheet All values in Rs. million • Key Highlights • - DE Ratio is 0.54 in FY 2010 • - Book Value per share FY 2010 is Rs 119 • - ROCE in FY 2010 is 20.23% • - Debt/EBIDTA in FY 2010 is only 1.8 times
Financial Projections HNGIL All values in Rs. million HNGFL ( Associate Company) All values in Rs. million HNGFL = HNG Float Glass Limited, where Company owns Equity Stake DISCLAIMER :“The projections disclosed above are merely indicative in nature and are purely based on management’s beliefs, opinions and estimates as of the date of this Presentation and no obligation is assumed to update such forward looking statements if these beliefs, opinions and estimates should change or to reflect other future developments. These projections are based on certain assumptions of future events over which the Company exercises no control. Hence this involves number of risks and uncertainties which could cause the actual results to differ materially from those that may be projected or implied.”
HNGIL’s Rating & Ranking • CRISIL Rating ( As on May ’10) • On “Fundamental” side 4/5 means “Superior Fundamentals” • On “Valuation” Side 5/5 means “Strong upside” • Business Standard Ranking ( Out of 1000 top listed corporates, as on Feb ’10) • In terms of Revenue – 299th • On Operating Profit Quantum – 265th • On Net Profit Quantum – 253rd • The latest long term credit rating of the Company is AA and it is PR1(+) for short term, both from CARE. • Certifications : ISO 9001:2000 and also accredited with HACCP .
“HNGIL – Strategic Moves” • Synergistic diversification by setting up of Rs.600 Crores Float glass project at Halol near Vadodara in Gujarat • Formed a JV with Omco, Belgium for designing and manufacturing of Moulds and Moulds accessories. • Greenfield Plant at Naidupeta, Andhra Pradesh – for manufacturing both Container glass and Float Glass already initiated and the site is supposed to be one of the largest single location glass manufacturing site in the World. • Technology tie-up with Global majors also in place to further boost our technological deliveries. • Aggressive growth plans through acquisitions – Both in India and Overseas. • Continued initiative on Capital cost reduction through 100 % Engineering Subsidiary - GEIL
Hindusthan National Glass & Industries Ltd. (HNGIL) THANK YOU For any queries/to obtain more info, please write at investor.relations@hngil.com