Download
1 / 20
510 likes | 1.23k Vues
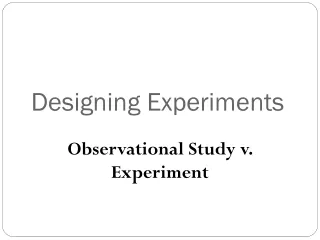
Designing experiments with several factors. Outlines: Factorial Experiments Two-factor factorial experiment General factorial experiments 2 k factorial designs. Factorial Experiments. Factorial experiment: Powerful technique for analysis experimental results with more than one factors.

E N D
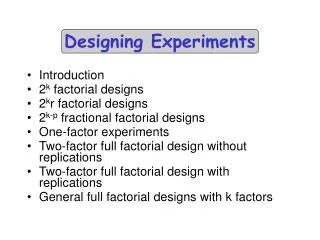
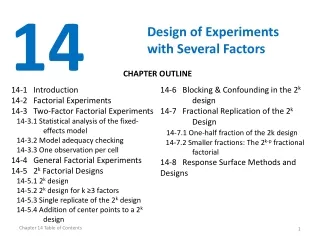
Designing experiments with several factors Outlines: • Factorial Experiments • Two-factor factorial experiment • General factorial experiments • 2k factorial designs
Factorial Experiments • Factorial experiment: Powerful technique for analysis experimental results with more than one factors. • Factorial experiment: investigate all possible combinations of the levels for the factors. • Main effect: the change in the response produced by a change in the level of the factor. • Main effect of A (B) : the difference between the average response at the high level of A (B) and the average response at the low level of A (B)
Factorial Experiments • Interaction: the dependency between factors. The difference in response between the levels of one factor is not the same at all level of the other factors. • At low level of B, the A effect is A=30-10=20 • At high level of B, the A effect is A=0-20=-20 • When an interaction is large, the corresponding main effects have very little meaning. • At different level of B, we can see the different effect of A. Very different depends on the level of B There is no factor A effect The knowledge of AB interaction is more useful than the main effect
Factorial Experiments • The AB Interaction effect can be calculated as the difference in the diagonal averages. • Ex.1 • Ex. 2 The AB interaction effect in Ex.2 is higher than Ex.1
Factorial Experiments • Main effect plots and interaction plots • Main effect plots: plot the values of average response at different levels for each factors. • Interaction plot: plot the response against the levels of each factor. Ex.1 Average response 15 35 Average response 20 30 Low high Factor A Low high Factor B Ex1 Ex2
Factorial Experiments • Three dimensional surface plot represents main effects and interaction effecs.
Two-factor factorial experiments • The simplest type of factorial experiment • 2 factors: A (with a levels) and B (with b levels) • The treatment has n replicates. There are a*b*n observations, run in random order. observation
Two-factor factorial experiments • The linear statistical model for each observation: • Statistical Analysis: A, B, AB, random error
Two-factor factorial experiments • Hypothesis • SS:
Two-factor factorial experiments • Degree of freedom: • MSE: • Test statistics:
Two-factor factorial experiments • Ex. Aircraft primer paints are applied to aluminum surfaces by two methods: dipping and spraying. The purpose of the primer is to improve paint adhesion, and some parts can be primed using either application method. The process engineering group responsible for this operation is interested in learning whether three different primers differ in their adhesion properties.
Two-factor factorial experiments X Ho / Ho >f0.05,2,12=3.89 >f0.05,1,12=4.75 <f0.05,2,12=3.89
Two-factor factorial experiments • Model Adequacy Checking • Residual = random error Eijk
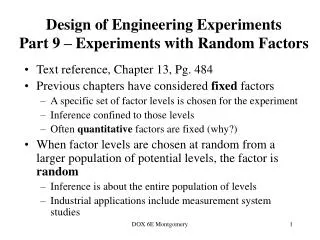
General Factorial Experiments • Involve more than 2 factors. For example, 3 factors A (a levels), B(b levels), C (c levels)
General Factorial Experiments • Ex. A mechanical engineer is studying the surface roughness of a part produced in a metal-cutting operation. Three factors, feed rate (A), depth of cut (B), and tool angle (C), are of interest. All three factors have been assigned two levels, and two replicates of a factorial design are run.
Exercise • The percentage of hardwood concentration in raw pulp, the freeness, and the cooking time of the pulp are being investigated for their effects on the strength of paper. The data from a three-factor factorial experiment are shown in the following table. (a) Analyze the data using the analysis of variance assuming that all factors are fixed. Use 0.05. (b) Find P-values for the F-ratios in part (a). (c) analyze the residuals from this experiment.
Exercise • The quality control department of a fabric finishing plant is studying the effects of several factors on dyeing for a blended cotton/synthetic cloth used to manufacture shirts. Three operators, three cycle times, and two temperatures were selected, and three small specimens of cloth were dyed under each set of conditions. The finished cloth was compared to a standard, and a numerical score was assigned. The results are shown in the following table. (a) State and test the appropriate hypotheses using the analysis of variance with 0.05. (b) Graphically analyze the residuals from this experiment.