NETWORK MODELS – CPM AND PERT
NETWORK MODELS – CPM AND PERT. CHAPTER. 13. Learning Objectives. Draw a network Calculate floats Identify critical activities and critical path Cost crashing Resource levelling PERT network Calculation of probability of completing project in certain time.


NETWORK MODELS – CPM AND PERT
E N D
Presentation Transcript
NETWORK MODELS – CPM AND PERT CHAPTER 13
Learning Objectives • Draw a network • Calculate floats • Identify critical activities and critical path • Cost crashing • Resource levelling • PERT network • Calculation of probability of completing project in certain time.
PROJECT COST AND TIME OVER-RUNS • The problem is so acute in India that a Ministry of Statistics and Programme Implementation has been set up. A flash report of the ministry, dealing with projects of Rs 100 Crores and above, for July 2009 reveals the following statistics: • No of projects monitored 602 • Original estimate Rs 544656.88 Crores • Anticipated cost Rs 600414.11 Crores • Cost overrun Rs 55757.23 Crores • Projects ahead of schedule 13 • Projects on schedule 145 • Projects delayed 370 • Projects with no fixed date of commissioning 74 • Delay ranges from 1 – 51 months. • Percentage of cost overruns in delayed projects 10.24% • Considering the magnitude of the problem, it is imperative that projects are managed properly
Definitions • Activity. It is a clearly defined project element, a job or a task which requires the consumption of resources including time. It is denoted by an arrow. • Event. An event describes the start or completion of an activity. It is denoted by a numbered circle. • Path. A path is an unbroken chain of activities from the initiating node to some other node, generally to the last node indicating the end or completion of the project. • Dummy Activity. A dummy activity is that activity which has a logical function only and consumes no time or resources. It is denoted by a dotted arrow. There are two types of dummies: • Identity Dummy. It helps to keep the designation of each activity unique or different from another. • Dependency Dummy. It helps to keep the logic correct.
Rules and Conventions • Activity arrows should be drawn from left to right indicating progressive approach towards the ultimate objective or the final event. • Crossing of activity arrows should be avoided. Arrows should be drawn as straight or bent lines but not curved lines. • Avoid use of unnecessary dummies. • Activities are set in the order of their execution. Events are set in the order of their occurrence.
Rules and Conventions • Head event number should be greater than tail event number. No event is numbered until the tail event of each activity arrow ending into that event has been numbered. • There should be no danglers or loops. Danglers are activities which lead no where. All activities must be connected to events and the finishing activities must be connected to the finish event of the project.
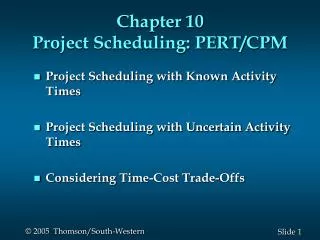
Critical Path Method • It is used where activity duration is known with certainty. • Activities are identified. • Dependency of activities is determined • Network is drawn • Earliest start times and latest finish times are calculated • Critical path and critical activities are identified
Example • Rasoi Appliances wants to launch a newly designed microwave oven. • Activities required for the launch have been identified. Their relationship with each other and the activity duration have also been determined.
D H 6 L 20 7 A E 2 5 6 18 F K 8 9 G B 1 9 10 3 7 8 C I J 4 7 8 14 2 • Start from the left and number the nodes as we move to the right of the network in the order of their appearance. If two or more nodes are on the same line, number from top to bottom. • If the dummy L had not been put, then node 5 would have been eliminated and activity E also would have ended at node 7. In that case, a reference to activity between nodes 2-7 would refer to both D and E causing problems of unique reference. • Consider the activities which can follow only A or B or C as these have been completed. D and E follow A, F and G follow B and I follows C. Add these activities to the net work. • Activity H is dependent on the completion of Activities D and E. Activity J is dependent on completion of Activities G and I. Add these activities to the network. • A dummy activity L has been drawn. This is an identity dummy. Add activity K which can start only when activities H, F and J are completed. • Drawing a Network. We can start with activities A, B and C as they have no predecessors.
Calculating Earliest Start Time (EST) • The earliest that the project can start is at time zero. • The earliest finish time for an activity is the earliest start time + activity duration. • The earliest start time of an activity which is dependent on two or more activities is the time at which all the preceding activities are completed.
6 2 5 8 9 1 3 4 7 At Node 8, we get From 7 to 8, 26 + 7 = 33. From 3 to 8, 7 + 9 = 16 From 6 to 8, 15 + 14 = 29. Earliest K can start is 33. Node 7 is the starting event for activity J. Activity J can start only when activities I and G are completed. Activity I can be completed earliest by 8 + 2 = 10, while G can end earliest on 7 + 8 = 15. Hence the earliest that J can start is the end of 15th day. At Node 9, EST = EST at Node 8 + duration of activity K = 33 + 10 = 43 At Node 5, EST is = EST at Node 2 + Activity Duration of E = 6 + 18 = 24 At Node 4, EST is = EST at Node 1 + Activity Duration of B = 0 + 8 = 8 At Node 6, EST is = EST at Node 2 + Activity Duration of D = 6 + 20 = 26, and (from Node 5 to Node 7) 24 + 0 = 24. Earliest H can start is 26. At Node 3, EST is = EST at Node 1 + Activity Duration of B = 0 + 7 = 7 At Node 2, EST is = EST at Node 1 + Activity Duration of A = 0 + 6 = 6 26 H D 7 20 L 6 A E 24 6 18 33 43 0 K F 7 9 10 G B 8 7 15 8 C J I 8 2 14
Latest Finish Time • The project will take 43 days. • Start form Node 9 as 43 days and work backward to find out the latest time when the starting event of an activity must occur, or the latest time by which all preceding activities must finish so that the project is not delayed
6 2 5 8 9 1 3 4 7 At Node 3, LFT is = LFT at Node 6 – Activity Duration of G or LFT at Node 8 – Activity Duration of F = 19 – 8 =11 or 33 – 9 = 24 If event 3 occurs at 24 then the project will get delayed. LFT is = 11 At Node 8, LFT is = LFT at Node 9 –Activity Duration of K = 43 – 10 = 33 At Node 6, LFT is = LFT at Node 8 –Activity Duration of H = 33 – 7 = 26 At Node 2, LFT at Node 5 – Activity Duration of E or LFT at Node 7 – Activity Duration of D. Take the smallest value. At Node 2, LFT is = 6 At Node 5, LFT is = LFT at Node 7 –Activity Duration of L = 26 – 0 = 26 At Node 4, LFT is = LFT at Node 6 –Activity Duration of I = 19 – 2 = 17 At Node 7, LFT is = LFT at Node 8 –Activity Duration of J = 33 – 14 = 19 At Node 1, LST = 0 26 26 H D 7 20 L 6 A E 26 24 6 6 18 33 43 0 11 K F 7 9 10 G B 33 43 8 7 0 15 8 C J I 8 2 14 17 19
Floats • Spare time in an activity is called float. It is used to economise on resources without affecting the overall duration of the project. • Types of floats • Total float • Free float • Interference float • Independent float
4 26 G 3 8 30 • Total Float. It is the spare time available on any given activity if the tail event occurred at its earliest time and the head event at its latest time. Total Float = Time Latest at Head – Time Earliest at Tail – Activity Duration. = 30 – 4 – 3 = 23 • Total Float. = 30 – 4 – 3 = 23 • Free Float. = 26 – 4 – 3 = 19 • Interference Float. It is equal to total float less free float. If this float is used up in an activity, it will interfere with the availability of floats available for subsequent activities. • Interference Float = Total Float – Free Float = 23 – 19 = 4 • Total Float. = 30 – 4 – 3 = 23 • Free Float. = 26 – 4 – 3 = 19 • Interference Float.= 23 – 19 = 4 • Independent Float. The spare time available in an activity which is neither affected by the use of float by preceding activities nor does it affect the float available in subsequent activities. • Independent Float = Time Earliest Head – Time Latest Tail – Duration. = 26 – 8 – 3 = 15 • Total Float. = 30 – 4 – 3 = 23 • Free Float. The spare time available on an activity if both the tail and the head events occur at their earliest time. If this spare time is used up during the execution of this activity, it will have no effect on subsequent activities. Free Float = Time Earliest Head – Time Earliest Tail – Activity Duration = 26 – 4 – 3 = 19
Identifying Critical Activities and Critical Path • All activities whose floats are zero are called critical activities. They are critical as they have no spare time available for their execution. Critical activities have the same EFT and LST at their start and finish nodes and have no float. • Management must exercise strict control to ensure that critical activities are executed as per schedule. • The path through these activities is called critical path.
26 26 H D 6 7 20 L 6 A 2 E 26 5 24 6 6 18 33 43 0 11 K F 8 9 7 9 10 G B 1 3 33 43 8 7 0 15 8 C J I 4 7 8 2 14 17 19 A,D,H and K are critical activities. Critical Path is 1 -2 – 7- 8 - 9
Cost Crashing • Some activities in a project can be completed in shorter time by employing extra resources. But the duration of all activities cannot be reduced by increasing resources because of their nature or because of the restrictions on employment due to space constraints and so on. • If an activity can be completed earlier, extra cost on extra resources will have to be incurred, but if this reduces the overall duration of the project this will result in reduction of the overhead costs. • Completing an activity in a shorter time than normal is referred to as activity crashing and the additional cost is called crash cost.
Example Fixed cost is Rs 500 per day.
Solution • Draw the network. • Calculate EST and LFT using normal times of activity duration. • Identify critical activities and path. • The duration of the project will reduce only if activities on critical path are crashed. • Crash the activity which is cheapest to crash. • After crashing any activity, recompute the timings and identify critical path. The path may change causing the critical activities to change. • Continue crashing activities in this manner till the objective has been achieved, i.e. lowest cost of project or minimum time.
Total cost Rs 47150 Direct cost Rs 29150 Indirect cost Rs 18000 18 4 19 C A 2 5 F 3 15 4 33 0 D 8 6 36 1 B 3 8 20 8 20 0 9 H G 6 10 7 I 12 20 31 L J 36 K E 4 7 8 5 7 9 11 11 20 31 B, G, L and J are critical activities and should be considered for crashing
Activity G is the cheapest to crash. Crash G by 2 days. • Recompute the timings and identify the critical path.
Total cost Rs 46550 Direct cost Rs 29550 Indirect cost Rs 17000 Cost reduced by Rs 600 Time reduced by 2 days 16 4 19 C A 2 5 F 3 15 4 31 0 D 8 6 34 1 B 3 8 18 8 18 0 9 H G 6 10 7 I 10 18 29 L J 34 K E 4 7 8 5 7 9 11 9 18 29 B, G, L and J are still critical activities. B, L and J should be considered for crashing
Activity J is the cheapest to crash. Crash J by 1 days. • Recompute the timings and identify the critical path.
Total cost Rs 46350 Direct cost Rs 29850 Indirect cost Rs 16500 Cost reduced by Rs 800 Time reduced by 3 days 15 4 19 C A 2 5 F 3 15 4 30 0 D 8 6 33 1 B 3 8 18 8 18 0 9 H G 6 10 7 I 10 18 29 L J 33 K E 4 7 8 4 7 9 11 9 18 29 B, G, L and J are still critical activities. B, and L should be considered for crashing
Activity L is the cheapest to crash. Crash L by 3 days. • Recompute the timings and identify the critical path.
Total cost Rs 45900 Direct cost Rs 30900 Indirect cost Rs 15000 Cost reduced by Rs 1250 Time reduced by 6 days 12 4 19 C A 2 5 F 3 15 4 27 0 D 8 6 30 1 B 3 8 18 8 18 0 9 H G 6 10 7 I 10 18 26 L J 30 K E 4 7 8 4 7 9 8 9 18 26 B, G, L and J are still critical activities. B should be considered for crashing
Crash activity B by 2 days • Recompute the timings and identify the critical path.
Total cost Rs 47900 Direct cost Rs 33900 Indirect cost Rs 14000 Cost increased by Rs 750 Time reduced by 8 days 12 4 19 C A 2 5 F 3 15 4 27 0 D 6 6 28 1 B 3 6 16 6 16 0 9 H G 6 10 7 I 10 16 24 L J 28 K E 4 7 8 4 7 9 8 7 16 24 B, G, L, J, E and K are now critical activities. Even if we crash E or K the duration on path B – G – L – J cannot be reduced any further. No further crashing is necessary
The project can be completed in 30 days at a least cost of Rs 45950. • The minimum time required to complete the project is 28 days at a cost of Rs 47900
Resource Levelling • All activities can start at the earliest time only if there are enough resources to perform all the work defined by the activities. • Often this may not be the case. It may also not be possible to follow a policy of ‘hire and fire’ always. • A reasonably steady level of resources throughout the project duration can be achieved by adjusting the start time of activities which have float available in them.
7 3 7 A D I 2 4 4 6 3 F C 3 3 2 14 0 10 2 B E G 6 3 5 1 2 3 4 5 10 0 14 H 8 • Draw the network. Calculate EST and LFT. Identify critical activities. A, D, F and G are critical activities.
Activ-ity EST LFT Days Men 1 2 3 4 5 6 7 8 9 10 11 12 13 14 A 0 3 3 3 B 0 5 2 2 C 2 7 2 3 D 3 7 4 2 E 2 10 3 3 F 7 10 3 3 G 10 14 4 3 H 0 14 8 1 I 7 14 6 2 • Make a table, listing the activities in the descending order of their latest finish times. • Plot the activities on a time graph • Red lines indicate critical activities schedule • Green lines indicate schedule of other activities if started earliest
Activ-ity EST LFT Days Men 1 2 3 4 5 6 7 8 9 10 11 12 13 14 A 0 3 3 3 B 0 5 2 2 C 2 7 2 3 D 3 7 4 2 E 2 10 3 3 F 7 10 3 3 G 10 14 4 3 H 0 14 8 1 I 7 14 6 2 Plot labour requirements on a time graph. • Red line shows labour required for critical activities • Green line indicates requirements if all activities are started earliest • Blue shows levelled resources. E and H are started later. 10 5 1 Labour
PERT Network • PERT – Programme Evaluation and Review Technique – is used in probabilistic situations when the duration of activities is not known with certainty. • Three time estimates are used for activity duration – pessimistic time, optimistic time and most likely time. • Mean time for each activity is calculated. • Network is drawn as for CPM with mean times as activity durations
PERT Network • Critical activities are identified. • Standard deviation on the critical path is calculated. • Using the standard deviation and the mean and assuming normal distribution, project duration with different levels of confidence or vice versa can be computed.
PERT - Network • Standard deviation cannot be added. Variance can be added. Standard deviation on the critical path is
D 5 3 2 6 A E H 2 6 2 7 4 11 4 0 15 19 2 B F L 1 3 8 9 2 7 4 0 6 G 19 15 6 2 12 C J K 4 7 3 2 2 10 12 11 5 • Draw the network and find critical activities C, J, K and L are critical activities. Critical path is 1 – 4 – 7 – 8 – 9 Project will be completed in 19 days or less with 50% confidence.
With 84% level of confidence how much time would the project take? • PERT assumes that the distribution of the total project completion time is normal. 84% represents Mean + 1 standard deviation. We can say with 84% level of confidence that the project will finish in 22 weeks. • What are the chances that the project will finish in 20 weeks? 0.33 SD 19 20 From normal distribution tables the probability when z =0.33 is 0.6290. There is a 63% chance that the project will finish in 20 weeks.
Differences – PERT and CPM • PERT is a probabilistic model and is based on three time estimates. It is used mainly for projects where the activity durations are uncertain, like research and development projects. Levels of confidence and probabilities can be associated with the completion date of a project. • CPM is based on certainty of the activity durations. It is used for projects where there is certainty about the time that each activity would take. The project completion duration is not probabilistic but is certain.
Summary • PERT and CPM are network analysis techniques that help in planning, monitoring and controlling projects. • PERT is a probabilistic model and deals with the uncertainty of activity durations. It is based on three time estimates – optimistic time, most likely time and pessimistic time. • CPM is a deterministic technique and activity duration is known with certainty. • Critical activities have no time slacks and it is vital that they completed as per schedule, else the project will be delayed causing time and cost over runs.
Summary • Management should monitor the critical activities closely in order to ensure timely completion of projects. • The slacks of time available in activities are called floats. These are used for levelling resources. • A time cost trade off can be calculated for a network by crashing critical activities. • Networks are a useful tool only if they are regularly updated. • Computer software packages exist that update and redraw the network once the progress on the activities is fed in.