Download
1 / 100
1.03k likes | 1.8k Vues
Electrical Events of the Cardiac Cycle Electrophysiology. Dr.s.a.moezzi. Cardiac Cycle. Cardiac Cycle : the electrical, pressure and volume changes that occur in a functional heart between successive heart beats. Phase of the cardiac cycle when myocardium is relaxed is termed diastole .

E N D
Electrical Eventsof the Cardiac CycleElectrophysiology Dr.s.a.moezzi
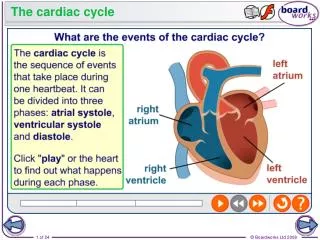
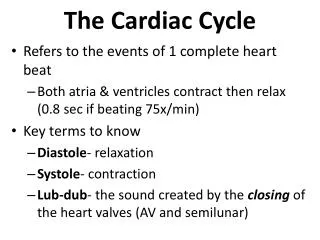
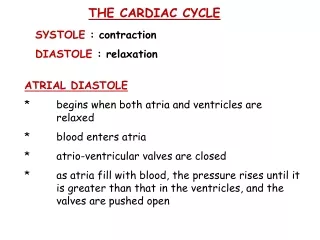
Cardiac Cycle Cardiac Cycle: the electrical, pressure and volume changes that occur in a functional heart between successive heart beats. • Phase of the cardiac cycle when myocardium is relaxed is termed diastole. • Phase of the cardiac cycle when the myocardium contracts is termed systole. • Atrial systole: when atria contract. • Ventricular systole: when ventricles contract.
Mechanical Events of the Cardiac Cycle • Ventricular Filling Period [ventricular diastole, atrial systole] • Isovolumetric Contraction Period [ventricular systole] • Ventricular Ejection Period [ventricular systole] • Isovolumetric Relaxation Period [ventricular diastole, atrial diastole]
Cardiac Cycle • Electrical changes in heart tissue cause mechanical changes, i.e. muscle contraction. • Thus, changes in electrical membrane potential of specific parts of the heart tissue represent mechanical events in specific areas of the heart tissue.
Electrocardiography • Two common abbreviations for electrocardiogram: EKG and ECG. • EKG comes from German language where cardiogram is written as kardiogram. • The ECG records the electrical activity of the heart. • Mechanical activity of the heart is sensed by echocardiography.
Electrophysiology • If an electrode is placed so that wave of depolarization spreads toward the recording electrode, the ECG records a positive (upward) deflection. • If wave of depolarization spreads away from recording electrode, a negative (downward) deflection occurs.
Electrophysiology • When myocardial muscle is completelypolarized or depolarized, the ECG will not record any electrical potential but rather a flat line, isoelectric line. • After depolarization, myocardial cells undergo repolarization to return to electrical state at rest.
Electrical Events of the Cardiac Cycle • Sinoatrial (SA) node is the normal pacemaker of heart and is located in right atrium. • Depolarization spreads from SA node across atria and results in the P wave. • Three tracts within atria conduct depolarization to atrioventricular (AV) node. • Conduction slows in AV node to allow atria to empty blood into ventricles before vent. systole. • Bundle of His connects AV to bundle branches. • Purkinje fibers are terminal bundle branches.
Electrical Conduction System • Sinoatrial node (SA node) • Intra-atrial Pathways • Atrioventricular node (AV node) • Bundle of His • Left and Right Bundle Branches • Purkinjie Fibers
The P wave • The first wave form is called a P wave: it represents Atrial depolarization. • It is gently rounded, and not larger than 2-3 mm. • It is usually positive (above the isoelectric line) • It should not be large, notched, or peaked
The QRS Complex • The QRS complex represents ventricular depolarization. • The Q wave is the first negative deflection. It should not be greater than 1mm wide or larger than 1/3 height of R wave. • The R wave is the first positive deflection after the Q wave. • The S wave is the first negative deflection after the R wave • The normal QRS complex should be < .12 sec.
The T wave • The T wave represents ventricular repolarization. • It is usually positive, but can be negative or biphasic. • It is usually the same polarity as the QRS complex.
The PR Interval • The PR interval is measured from the beginning of the P wave to the beginning of the QRS complex. • The PR interal measures the beginning of atrial depolarization through the beginning of ventricular depolarization. • The normal PR interval is from .12-.20 seconds.
The QT Interval • The QT interval is measured from the beginning of the Q wave to the end of the T wave. This measures ventricular depolarization and repolarization. • Any QT longer than .50 seconds can predispose certain dangerous arrhythmias.
ST Segment • The ST segment is measured from the end of the S wave to the beginning of the T wave. • The ST segment is normally isoelectric, or curves slightly upwards into the T wave. • Horizontal or downsloping ST depression of 2 mm or more is abnormal, indicating ishemia. • ST segment elevation > 1mm indicates myocardial infarction
ECG Time & Voltage • ECG machines can run at 50 or 25 mm/sec. • Major grid lines are 5 mm apart; at standard 25 mm/s, 5 mm corresponds to .20 seconds. • Minor lines are 1 mm apart; at standard 25 mm/s, 1 mm corresponds to .04 seconds. • Voltage is measured on vertical axis. • Standard calibration is 0.1 mV per mm of deflection.
Standard 12-Lead ECG • Usually performed when person is resting in supine position. • three bipolar limb leads: I, II, and III; • three augmented voltage leads: aVR, aVL, aVF; • six precordial leads: V1 – V6. • All limb leads lie in frontal plane. • Chest leads circle heart in transverse plane.
Standard 12-Lead ECG • Each lead provides a different electrical angle or picture of the heart. • Anterior part of heart by looking at V1 – V4. • Lateral view of heart: I, aVL, V5 and V6. • Inferior view of heart: II, III, and aVF.
12-Lead ECG • Limb lead II shows largeR amplitude because left ventricle current vector lies parallel with electrode placement. • Chest lead V1has large S wave because left ventricle current vector is directed away from electrode.
What types of pathology can we identify and study from EKGs? • Arrhythmias • Myocardial ischemia and infarction • Pericarditis • Chamber hypertrophy • Electrolyte disturbances (i.e. hyperkalemia, hypokalemia) • Drug toxicity (i.e. digoxin and drugs which prolong the QT interval)
Interpretation of ECG:Rate First measurement to calculate is heart rate. PQRST waves represent one complete cardiac cycle. • At standard paper speed, divide 1500 by distance between R to R waves. • Find R wave on heavy line. Count off 300, 150, 100, 75, 60 for each following line. Where next R lands is quick estimate. • Multiply number of cycles in 6 second marks by 10.
The Rule of 300 It may be easiest to memorize the following table:
10 Second Rule As most EKGs record 10 seconds of rhythm per page, one can simply count the number of beats present on the EKG and multiply by 6 to get the number of beats per 60 seconds. This method works well for irregular rhythms.
What is the heart rate? The Alan E. Lindsay ECG Learning Center ; http://medstat.med.utah.edu/kw/ecg/ 33 x 6 = 198 bpm