Download
1 / 23
230 likes | 376 Vues
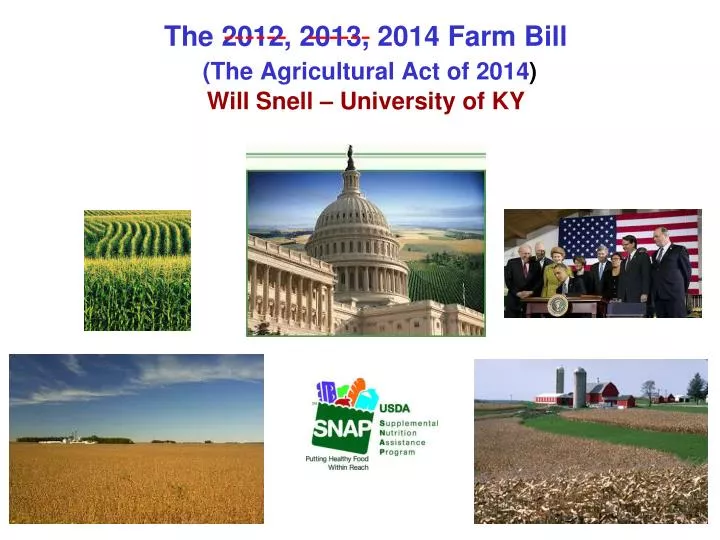
The 2012, 2013, 2014 Farm Bill (The Agricultural Act of 2014 ) Will Snell – University of KY. ------. ------. General Info About Farm Bill/Today’s Session. USDA is working on regs … much still unknown Signup anticipated later this fall/winter Calculators and decision tools being devolved

E N D
The 2012, 2013, 2014 Farm Bill(The Agricultural Act of 2014)Will Snell – University of KY ------ ------
General Info About Farm Bill/Today’s Session • USDA is working on regs … much still unknown • Signup anticipated later this fall/winter • Calculators and decision tools being devolved • Today’s focus will be primarily on program crops 2014 Farm Bill
The 2014 Farm Bill Political Environment • Record Federal Budget Deficit • Record Farm Income • Challenging Political Make-up in Congress
The Nutrition Title Dominated the Debate on the Current Farm Bill Senate: -- $4 billion of cuts in SNAP funding over 10 years House: -- $40 billion of cuts in SNAP funding over 10 years Final Result: 8 billion of cutsin SNAP funding over 10 years
2014 Farm Bill Expenditures (2014-2023)
2014 Farm Bill ($956 billion/10 years) Source: CBO
Major Ag Components of the 2014 Farm Bill Covers 2014-2018 Crop Years Eliminates Direct Payments, Countercyclical Program, and ACRE Creates a new price support (PLC) and a new revenue program (ARC) Creates a new insurance option (SCO) Revises the Dairy Program Consolidates Conservation Programs Establishes a permanent livestock disaster program.
2014 Farm Bill Grain Farmers Will Have to Make 3 Decisions Up Front For the Life of the 2014 Farm Bill
2014 Farm Bill Decisions for Program Crops (Corn, Soybeans, Wheat …) RetainORReallocate Base Acres Reallocation based on share of 2009-2012 acres planted for program crops Reallocation can’t exceed 2013 base acres RetainORUpdate Program Payment Yields Update based on 90% of farm’s 2008-2012 average yields
2014 Farm Bill Decisions Cont. One-time, Irrevocable Option to Select One of the Following Price Loss Coverage (PLC) – safety net for prices Agricultural Risk Coverage (ARC) – safety net for revenue County Individual farm (crop by crop decision) (crop by crop decision) (whole farm – all crops) Decision must be agreed upon by all owners/tenants and will be in effect through 2018. --- if no decision, no payments for 2014, and default to PLC for 2015-2018.
Price Loss Coverage (PLC) Payment made when national marketing year average price is less than the fixed “reference” price • Payment Rate: Reference Price – Marketing Year Avg. Price • Payment = Payment Rate x Payment Yield x 85% x Base Acres • Option of purchasing additional subsidized insurance protection called Supplemental Coverage Option Insurance in 2015
Price Loss Coverage (PLC) Corn Example Assumptions • U.S. Market Year Average Price: $3.50/bu • Reference Price for Corn: $3.70/bu • Farm’s Payment Yield: 150 bu. • Farm’s Base Acres: 100 acres Payment Calculations Payment Rate = $3.70 (Reference Price) - $3.50 (Market Price) = $0.20/bu PLC Payment = $0.20 (Payment Rate) x 150 (Payment Yield) x 100 (Base Acres) = $3000 x 85% = $2550 or $25.50/acre
Agricultural Risk Coverage (ARC) Two Options – County or Individual Farm County Coverage: Payments made when Actual County Revenue is below County Revenue Guarantee Actual County Revenue = (actual average county yield) x (U.S. average market price) County Revenue Guarantee = 86% x benchmark revenue which is calculated as (average county yield over last five years (dropping high and low)) x (U.S. average price over last five years (dropping high and low)) Payment Rate is capped at 10% of benchmark guarantee Payment acres = 85% of base acres Individual Farm Coverage: Payments made when Actual Crop Revenue fall below Individual Revenue Guarantee Actual Crop Revenue = (national average price) x (farm yield) x (weighted crop acres) summed for all crops Individual Revenue Guarantee = 86% x benchmark revenue which is calculated as weighted average revenue of crops over last five years dropping out high and low Payment Rate is capped at 10% of benchmark guarantee Payment acres = 65% of base acres
Agricultural Risk Coverage (ARC) for Corn COUNTY $5.30 * 151 $800 * 86% Maximum Payment is 10% of Benchmark Revenue or $80/acre in this example
Agricultural Risk Coverage (ARC) INDIVIDUAL (75% Corn, 25% Soybeans) Benchmark Revenue (Corn) ($685+ $907+810)/3 = $800 Benchmark Revenue (Beans): ($432+ $500+$576)/3 = $502 Farm Benchmark Revenue: ($800 x 75%) + ($502 x 25%) = $725 Farm Revenue Guarantee: $725 x 86% = $624 Maximum Payment is 10% of Benchmark Revenue or $72.50/acre in this example
Agricultural Risk Coverage (ARC) INDIVIDUAL (75% Corn, 25% Beans) Agricultural Economics
Early Observations on PLC vs ARC Selection on PLC vs ARC will depend on individual’s price expectations (and individual yields relative to county yields) • “If multi-year average prices for corn are expected to be over $3.70 over the next five years, ARC will provide better protection since PLC will never trigger payments. If prices are expected to be very low, averaging less than $3/bu, PLC will provide better support. Corn prices between $3 and $3.70 are more of a toss-up.” Jonathan Coppess and Nick Paulson, University of Illinois • Decision-Making Tools being developed to assist producers
Payment Limitations Producers whose AGI exceeds $900,000 are not eligible to receive payments/benefits from FSA or NRCS programs Annual payment limits for PLC, ARC, LDPs, capped at $125,000/person or $250,000/ couple Separate $125,000 cap for livestock programs 2014 calls for USDA to define “actively engaged” to determine eligibility for payments
Conservation Programs Condenses the number of conservation programs from 23 to 13. Reduces the Conservation Reserve Program (CRP) maximum enrollment from 27.5 million acres in 2014 to 24 million acres in 2018 Conservation Programs Reduced $4 billion/10 years, but EQIP funding increased by $0.5 billion/10 years Requires conservation compliance with highly erodible land and wetland conservation practices to be eligible for crop insurance premium subsidies.
Other Components Authorizes colleges, universities, and state departments of agriculture to develop pilot research projects for industrial hemp in states that have passed legislation supporting hemp production. Establishes a new dairy policy with an insurance product protecting dairy profit margins (based on difference of milk prices and feed costs) Reauthorizes a Beginning Farmer and Rancher Development Program Provides additional assistance for livestock disaster and specialty crop grants