Download
1 / 11
110 likes | 194 Vues
Explore underlying patterns in economic models through an Encyclopedia of mathematical and economic terms. Learn how Break-Even Analysis analyzes profitability in sales-based businesses. Discover Break-Even Point in economics and solution methods including algebraic and chart representation.

E N D
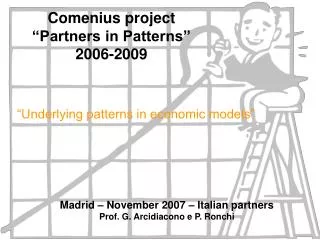
Comenius project “Partners in Patterns” 2006-2009 “Underlying patterns in economic models” Madrid – November 2007 – Italian partners Prof. G. Arcidiacono e P. Ronchi
Our proposal To look for underlying pattern in economic models. To built and publish on the web an Encyclopedia of mathematical and economic terms using the languages of the European partners. An example…….
ANALYSIS BREAK EVEN
BREAK EVEN ANALYSIS Meaning Analysis of total costs – sale of product-total revenue Aims to analyze the potential profitability of an expenditure in a sales-based business.
OBJECTIVEThe break even point for a productis the point where total revenue received equals total costs associated with the sale of the product It is typically calculated in order for businness to determine if it would be profitable to sell a proposed product, as opposed to attempting to modify an existing product instead so it can be made lucrative. BREAK EVEN POINTin economics is the point at which cost or expenses and income are equal - there is no net loss or gain, one has "broken even".
Solution methods: 1. ALGEBRIC : BEP quantity is calculated by the profit equation: Profit=Revenues-cost2. BY CHART: In its simplest form, the break even chart is a graphical representation of costs at various levels of activity shown on the same chart as the variation of income.
1. ALGEBRIC METHOD q = quantity of product and quantity sold cv = variable cost per unit p = selling price per unit CF = total fixed cost per unit CV = progressive variable costs per year CT = total costs per year RT = total revenues per year CT = CF + CV = CF + cv x q RT = p x q CT=RT B.E.P. occurs when
CT = RT CF + cv x q = p x q CF q = p - cv p – cv = margine unitario di contribuzione, con il quale ogni prodotto partecipa alla copertura dei costi fissi
A C P B WIRIS GRAPHICItalian WIRIS server O In the diagram above, the line OA represents the variation of income at varying levels of production activity ("output"). B C represents the total fixed costs in the business. As output increases, variable costs are incurred, meaning that total costs (fixed + variable) also increase. At low levels of output, Costs are greater than Income. At the point of intersection, P, costs are exactly equal to income, and hence neither profit nor loss is made.